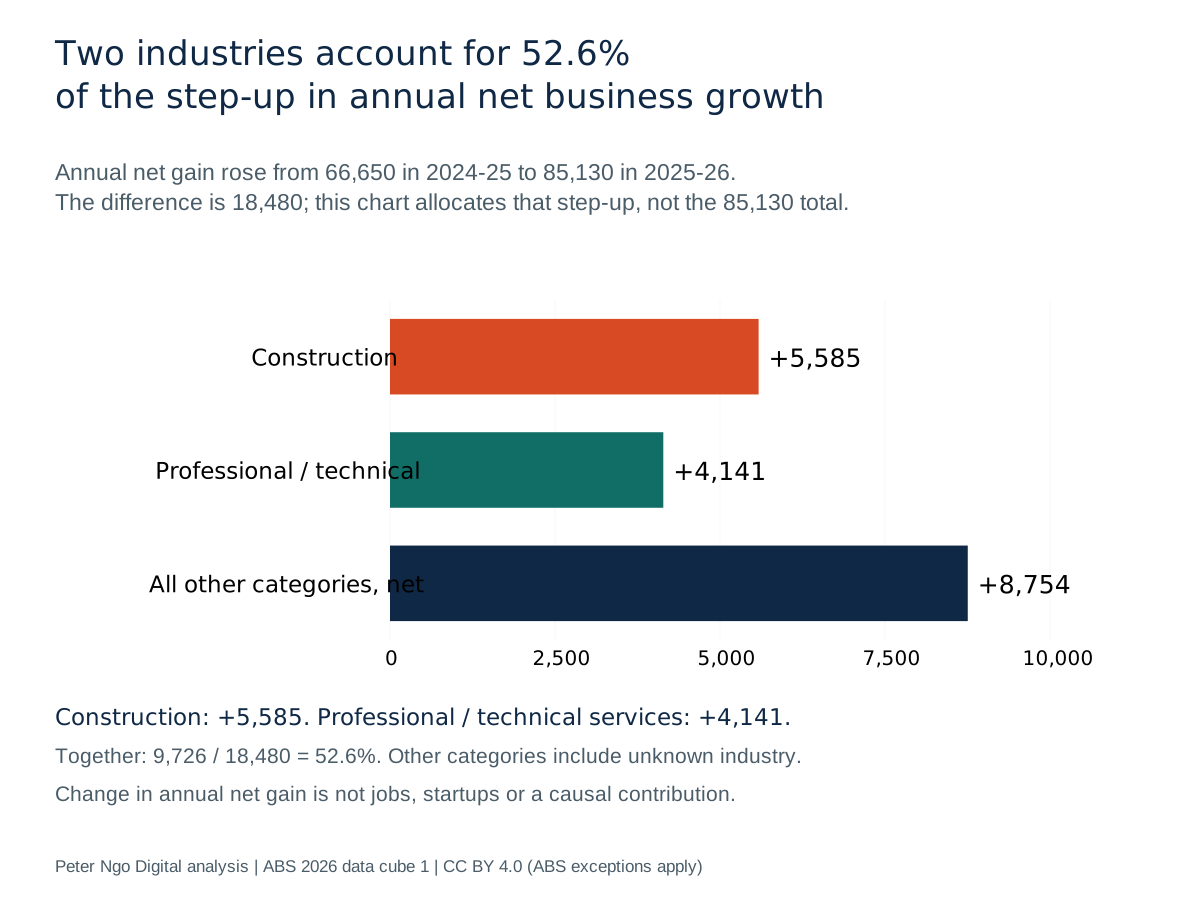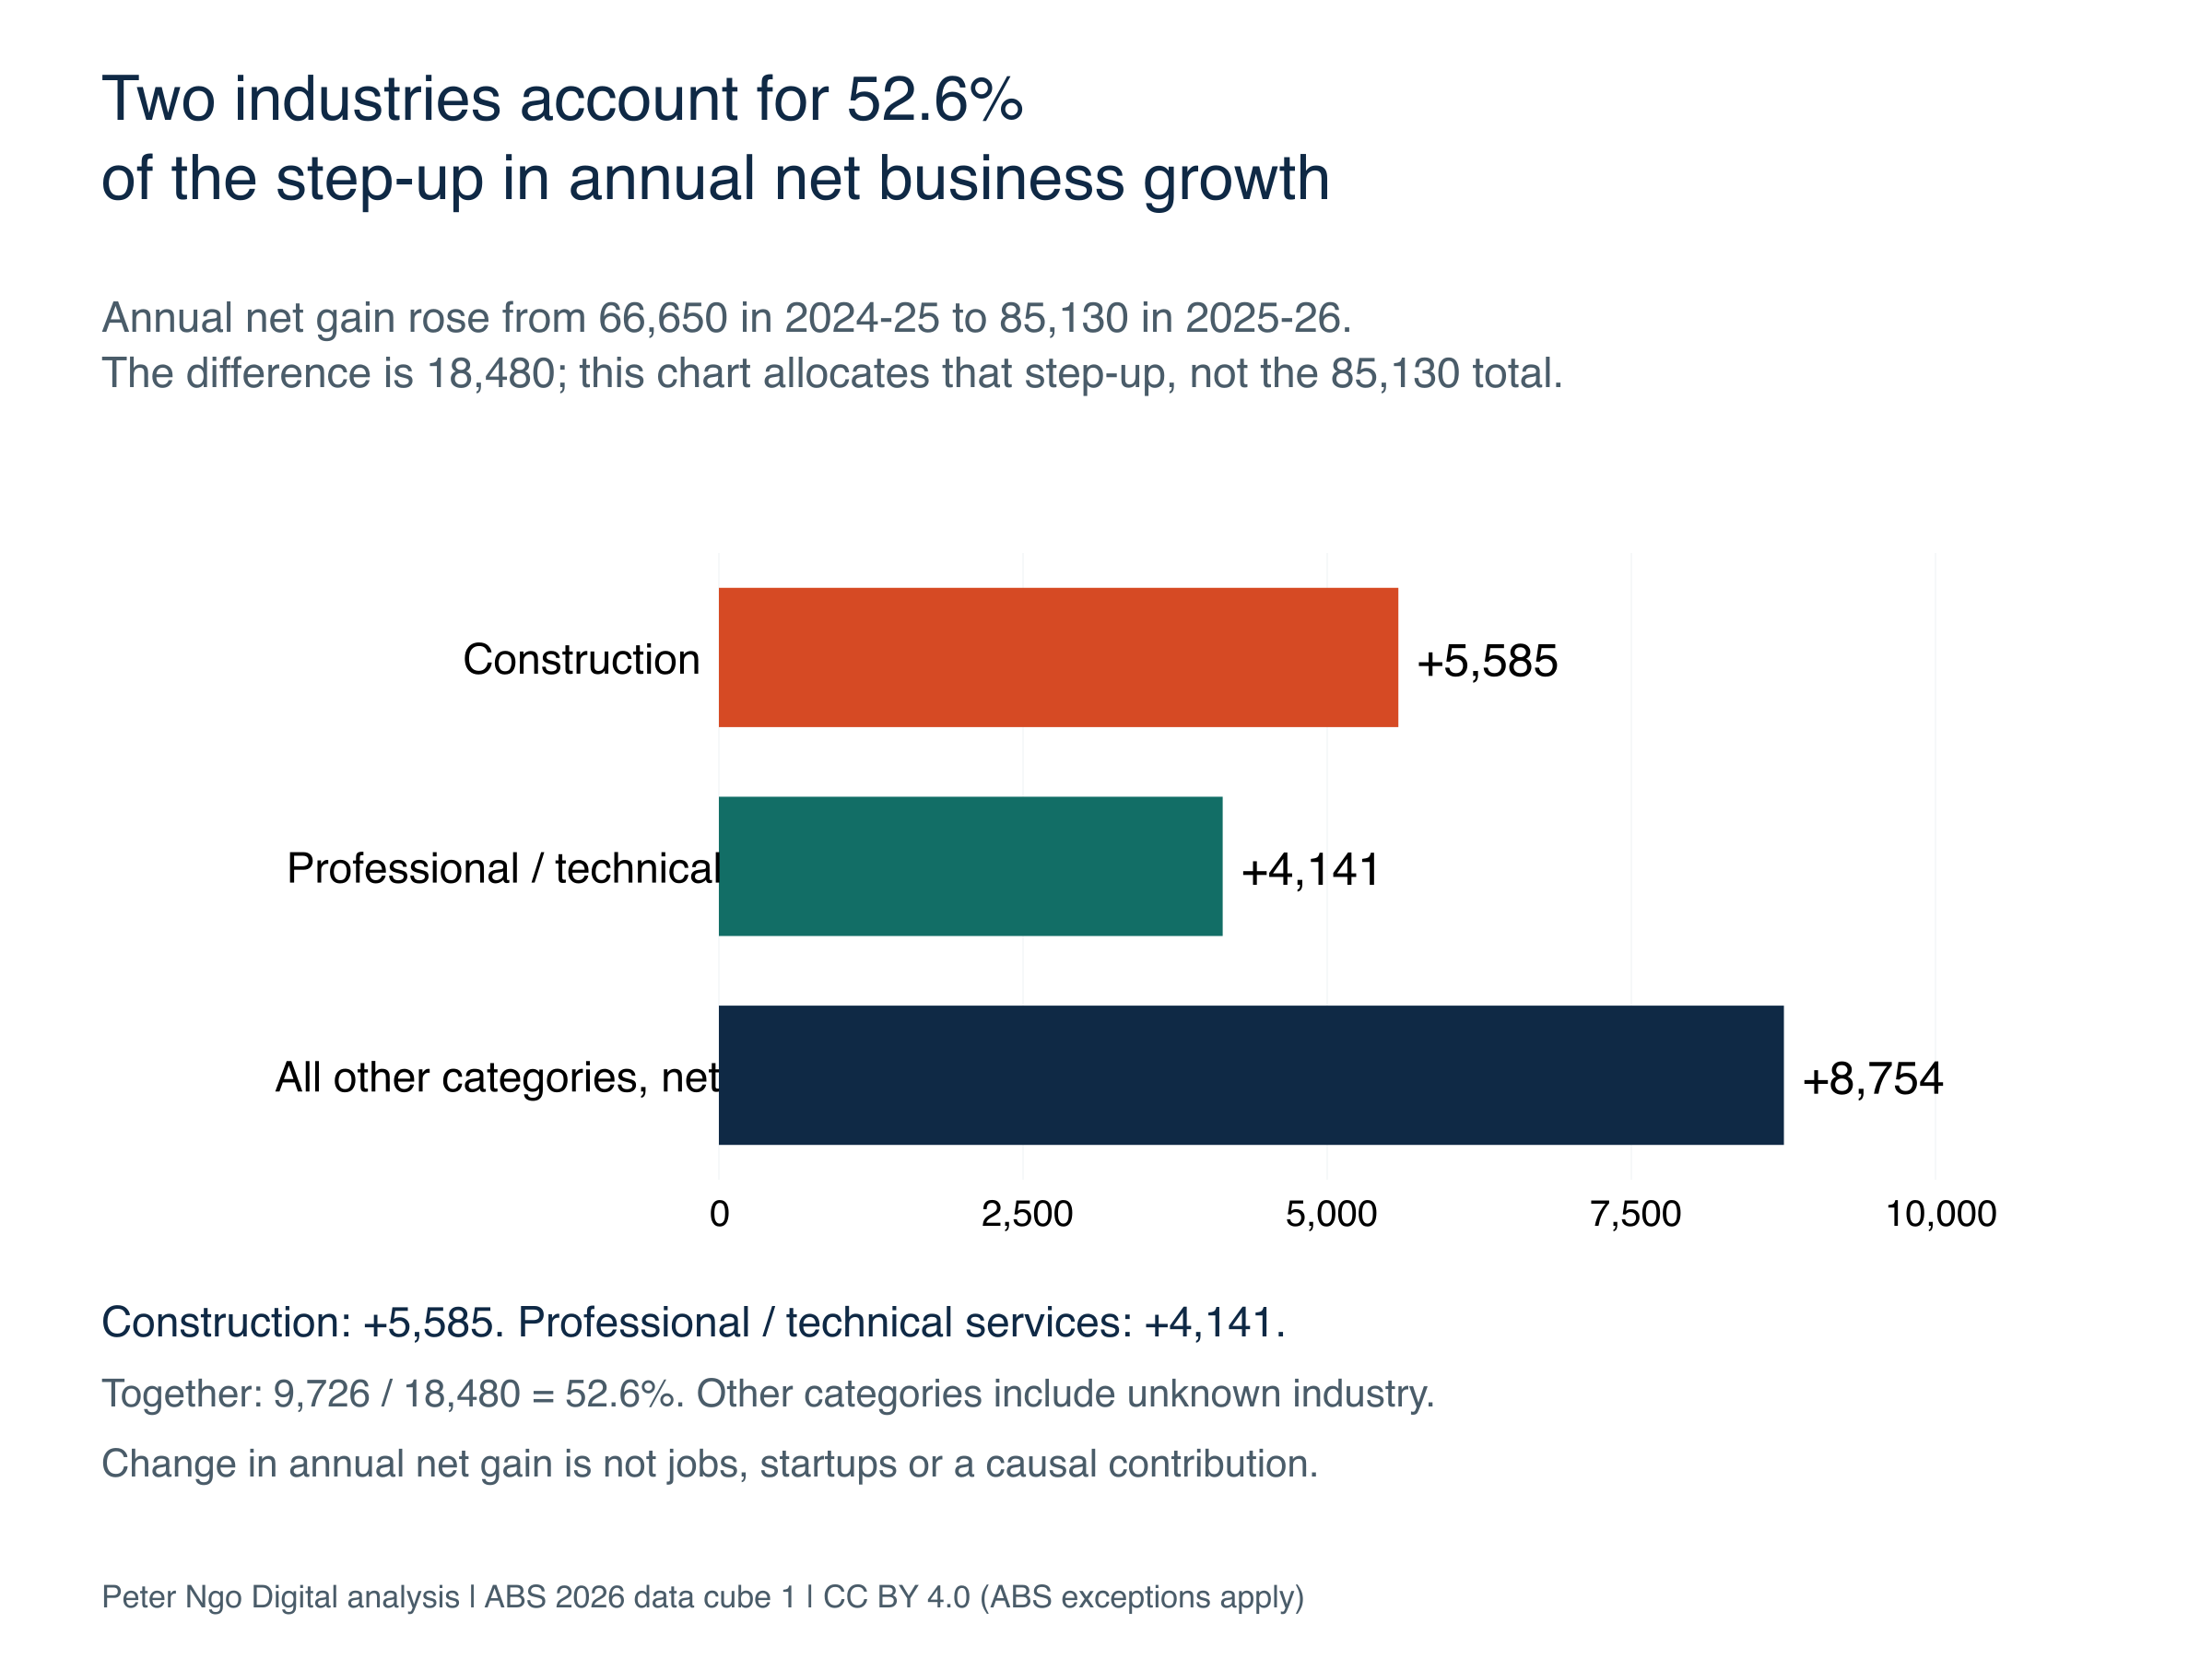
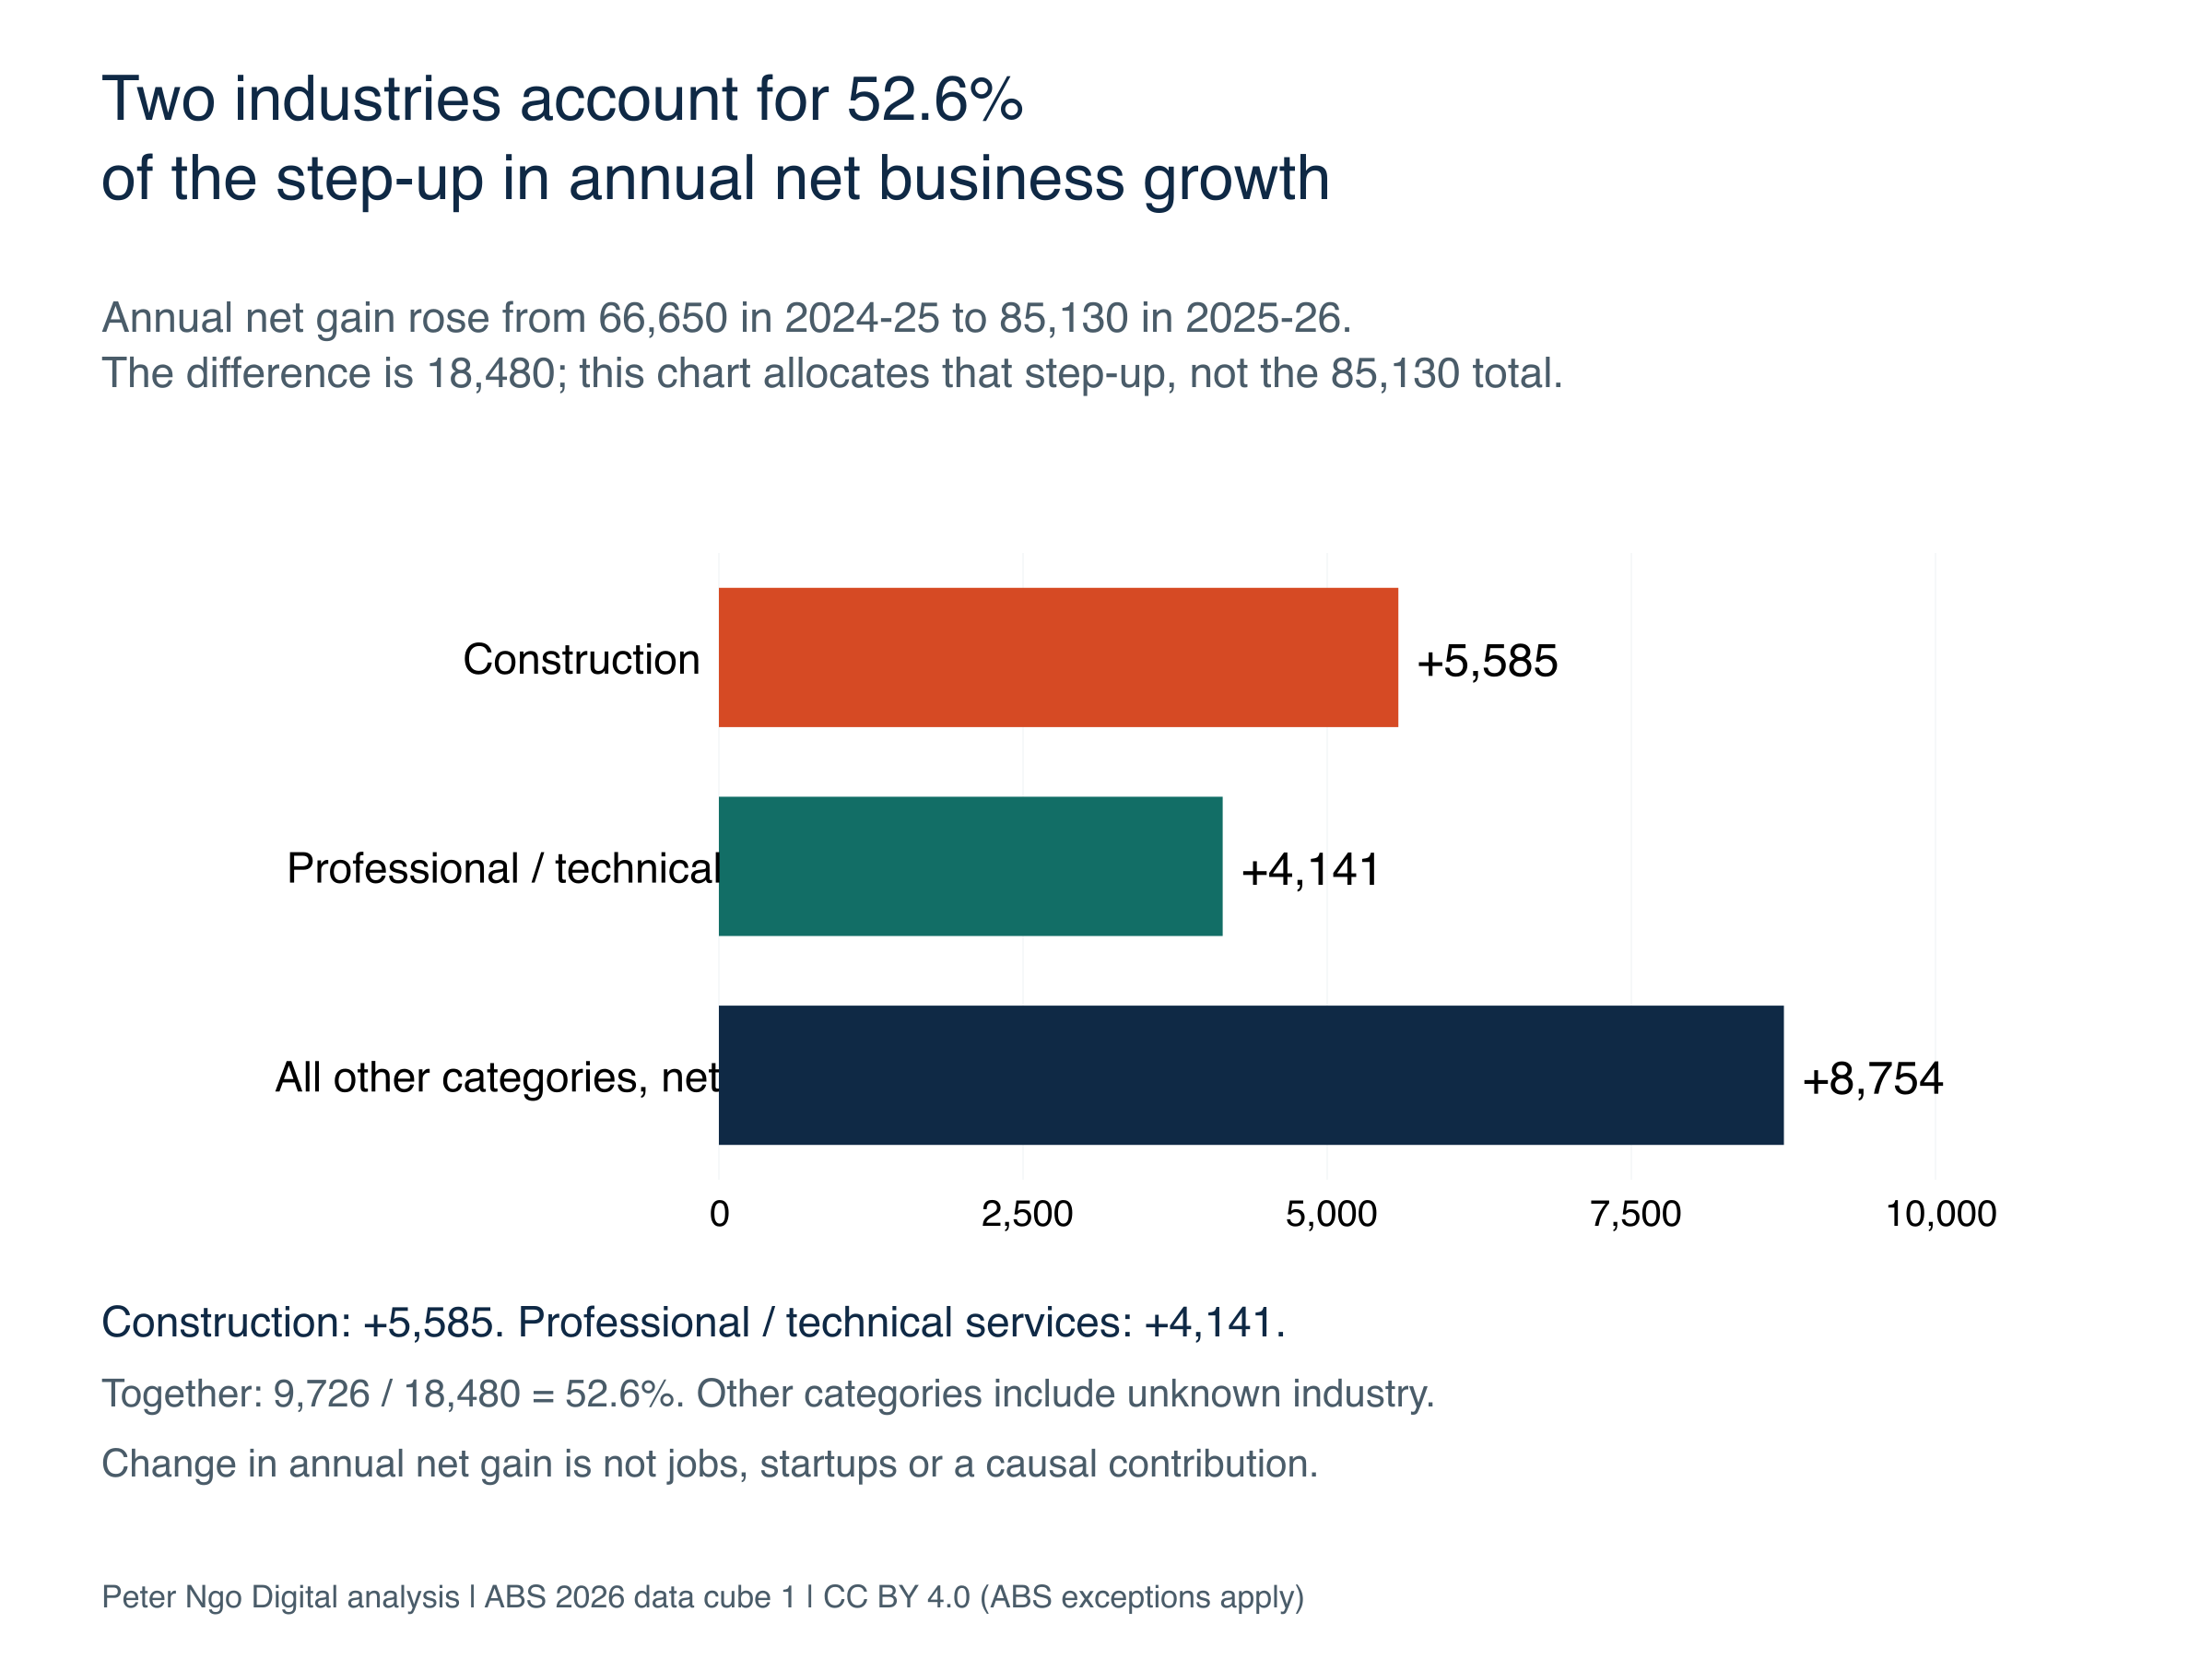
Construction and professional services accounted for 52.6% of the pickup in Australia’s annual net business gain in 2025–26. Together, the two divisions added 9,726 to the increase from the previous year, according to my analysis of the latest ABS business counts.
Australia’s annual net gain rose from 66,650 to 85,130 businesses, a pickup of 18,480. The 52.6% is a share of that pickup, rather than a share of all 85,130 additional businesses. That distinction tells you where growth strengthened, even when the fastest growing industry stayed the same.
Prepared 3 November 2026. The 2026 national analysis uses the ABS release of 18 August 2026. The council comparison below is explicitly June 2024–2025 because detailed 2026 council tables are scheduled for 18 December 2026. This study reports counts and accounting comparisons, without attributing causes or job creation.
Three findings, with the evidence beside them
- 2026 growth pickup: construction and professional, scientific and technical services account for 9,726 of the 18,480 step-up in annual net gain, or 52.6%. Calculation CSV · Chart SVG · Reference wording.
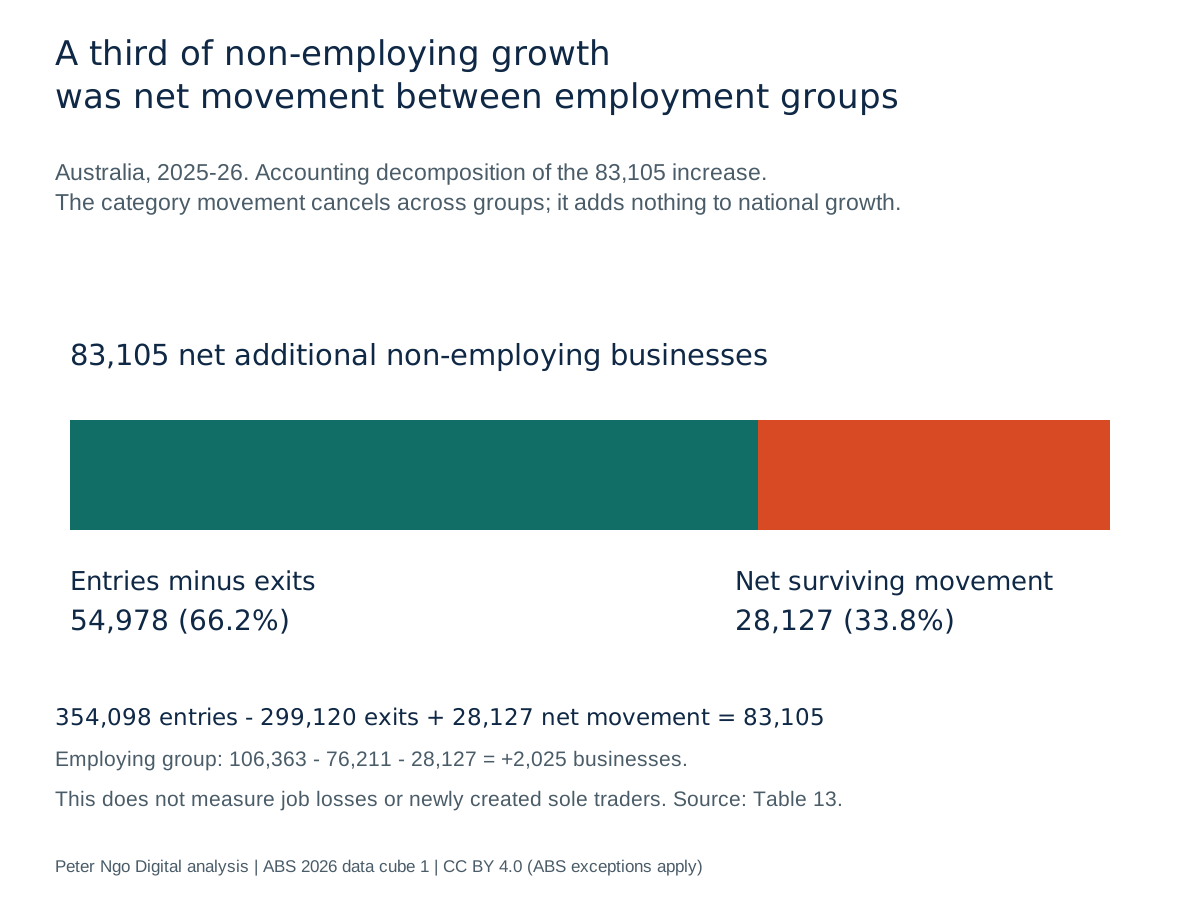
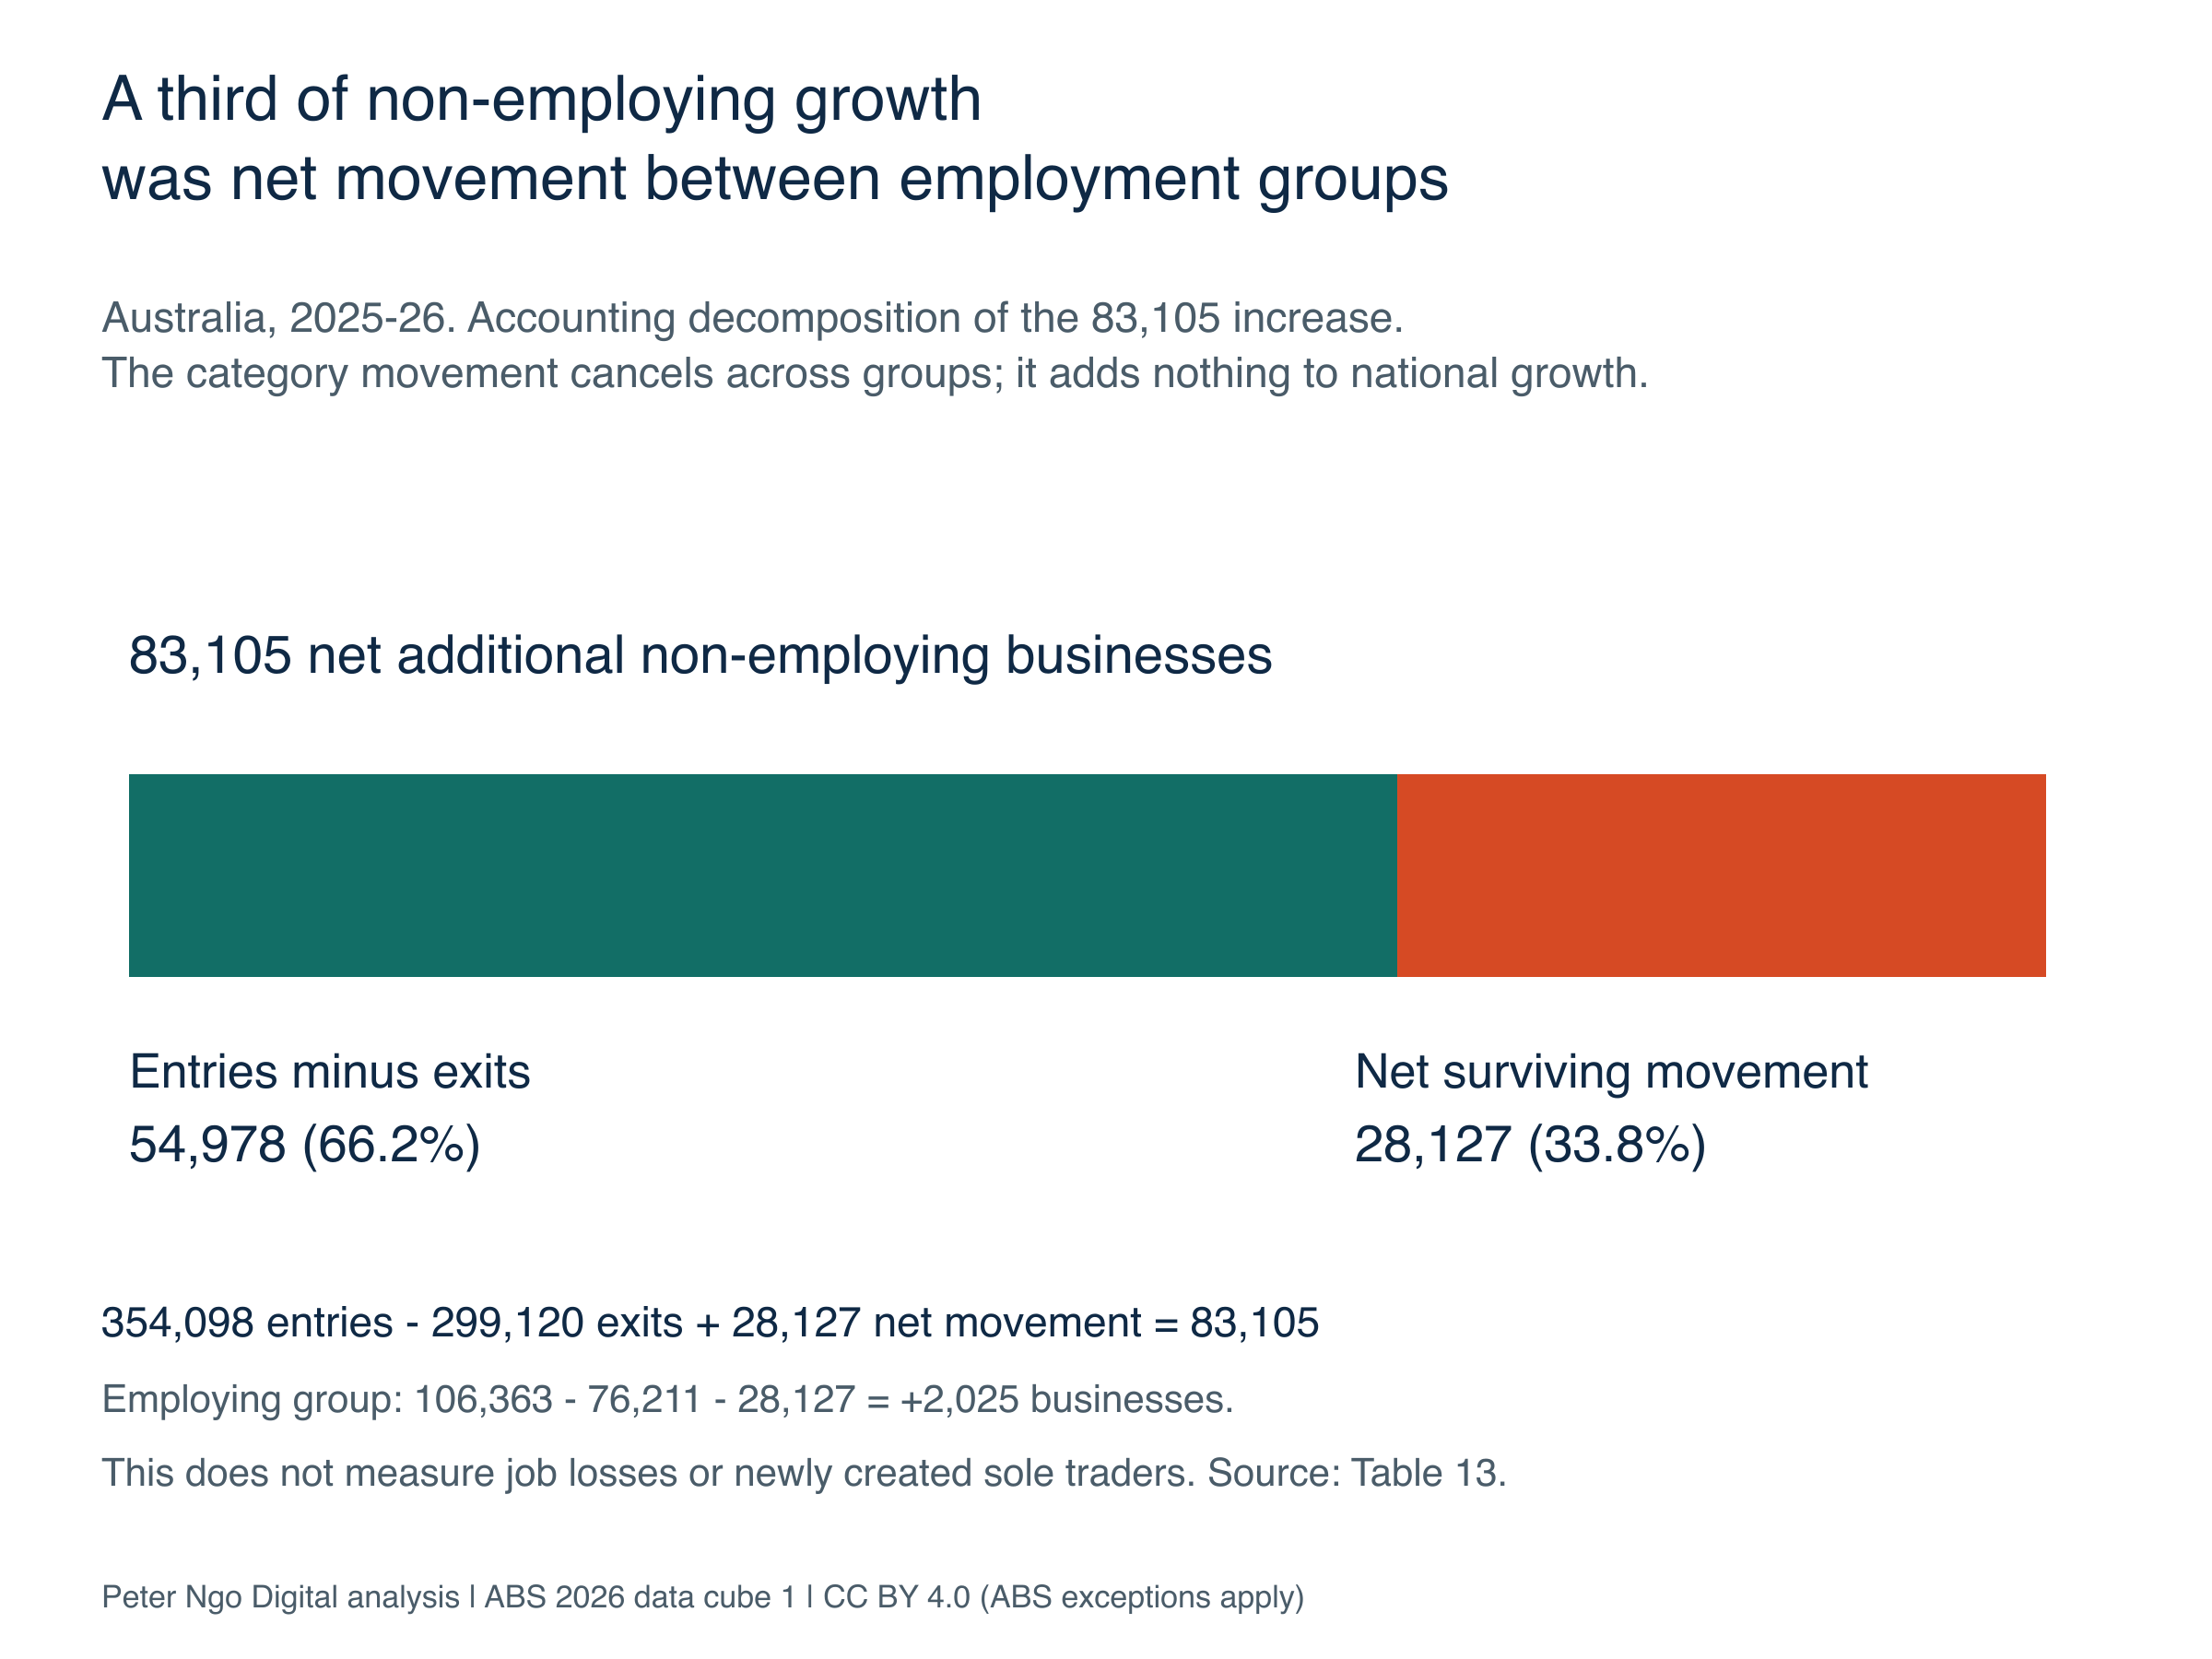
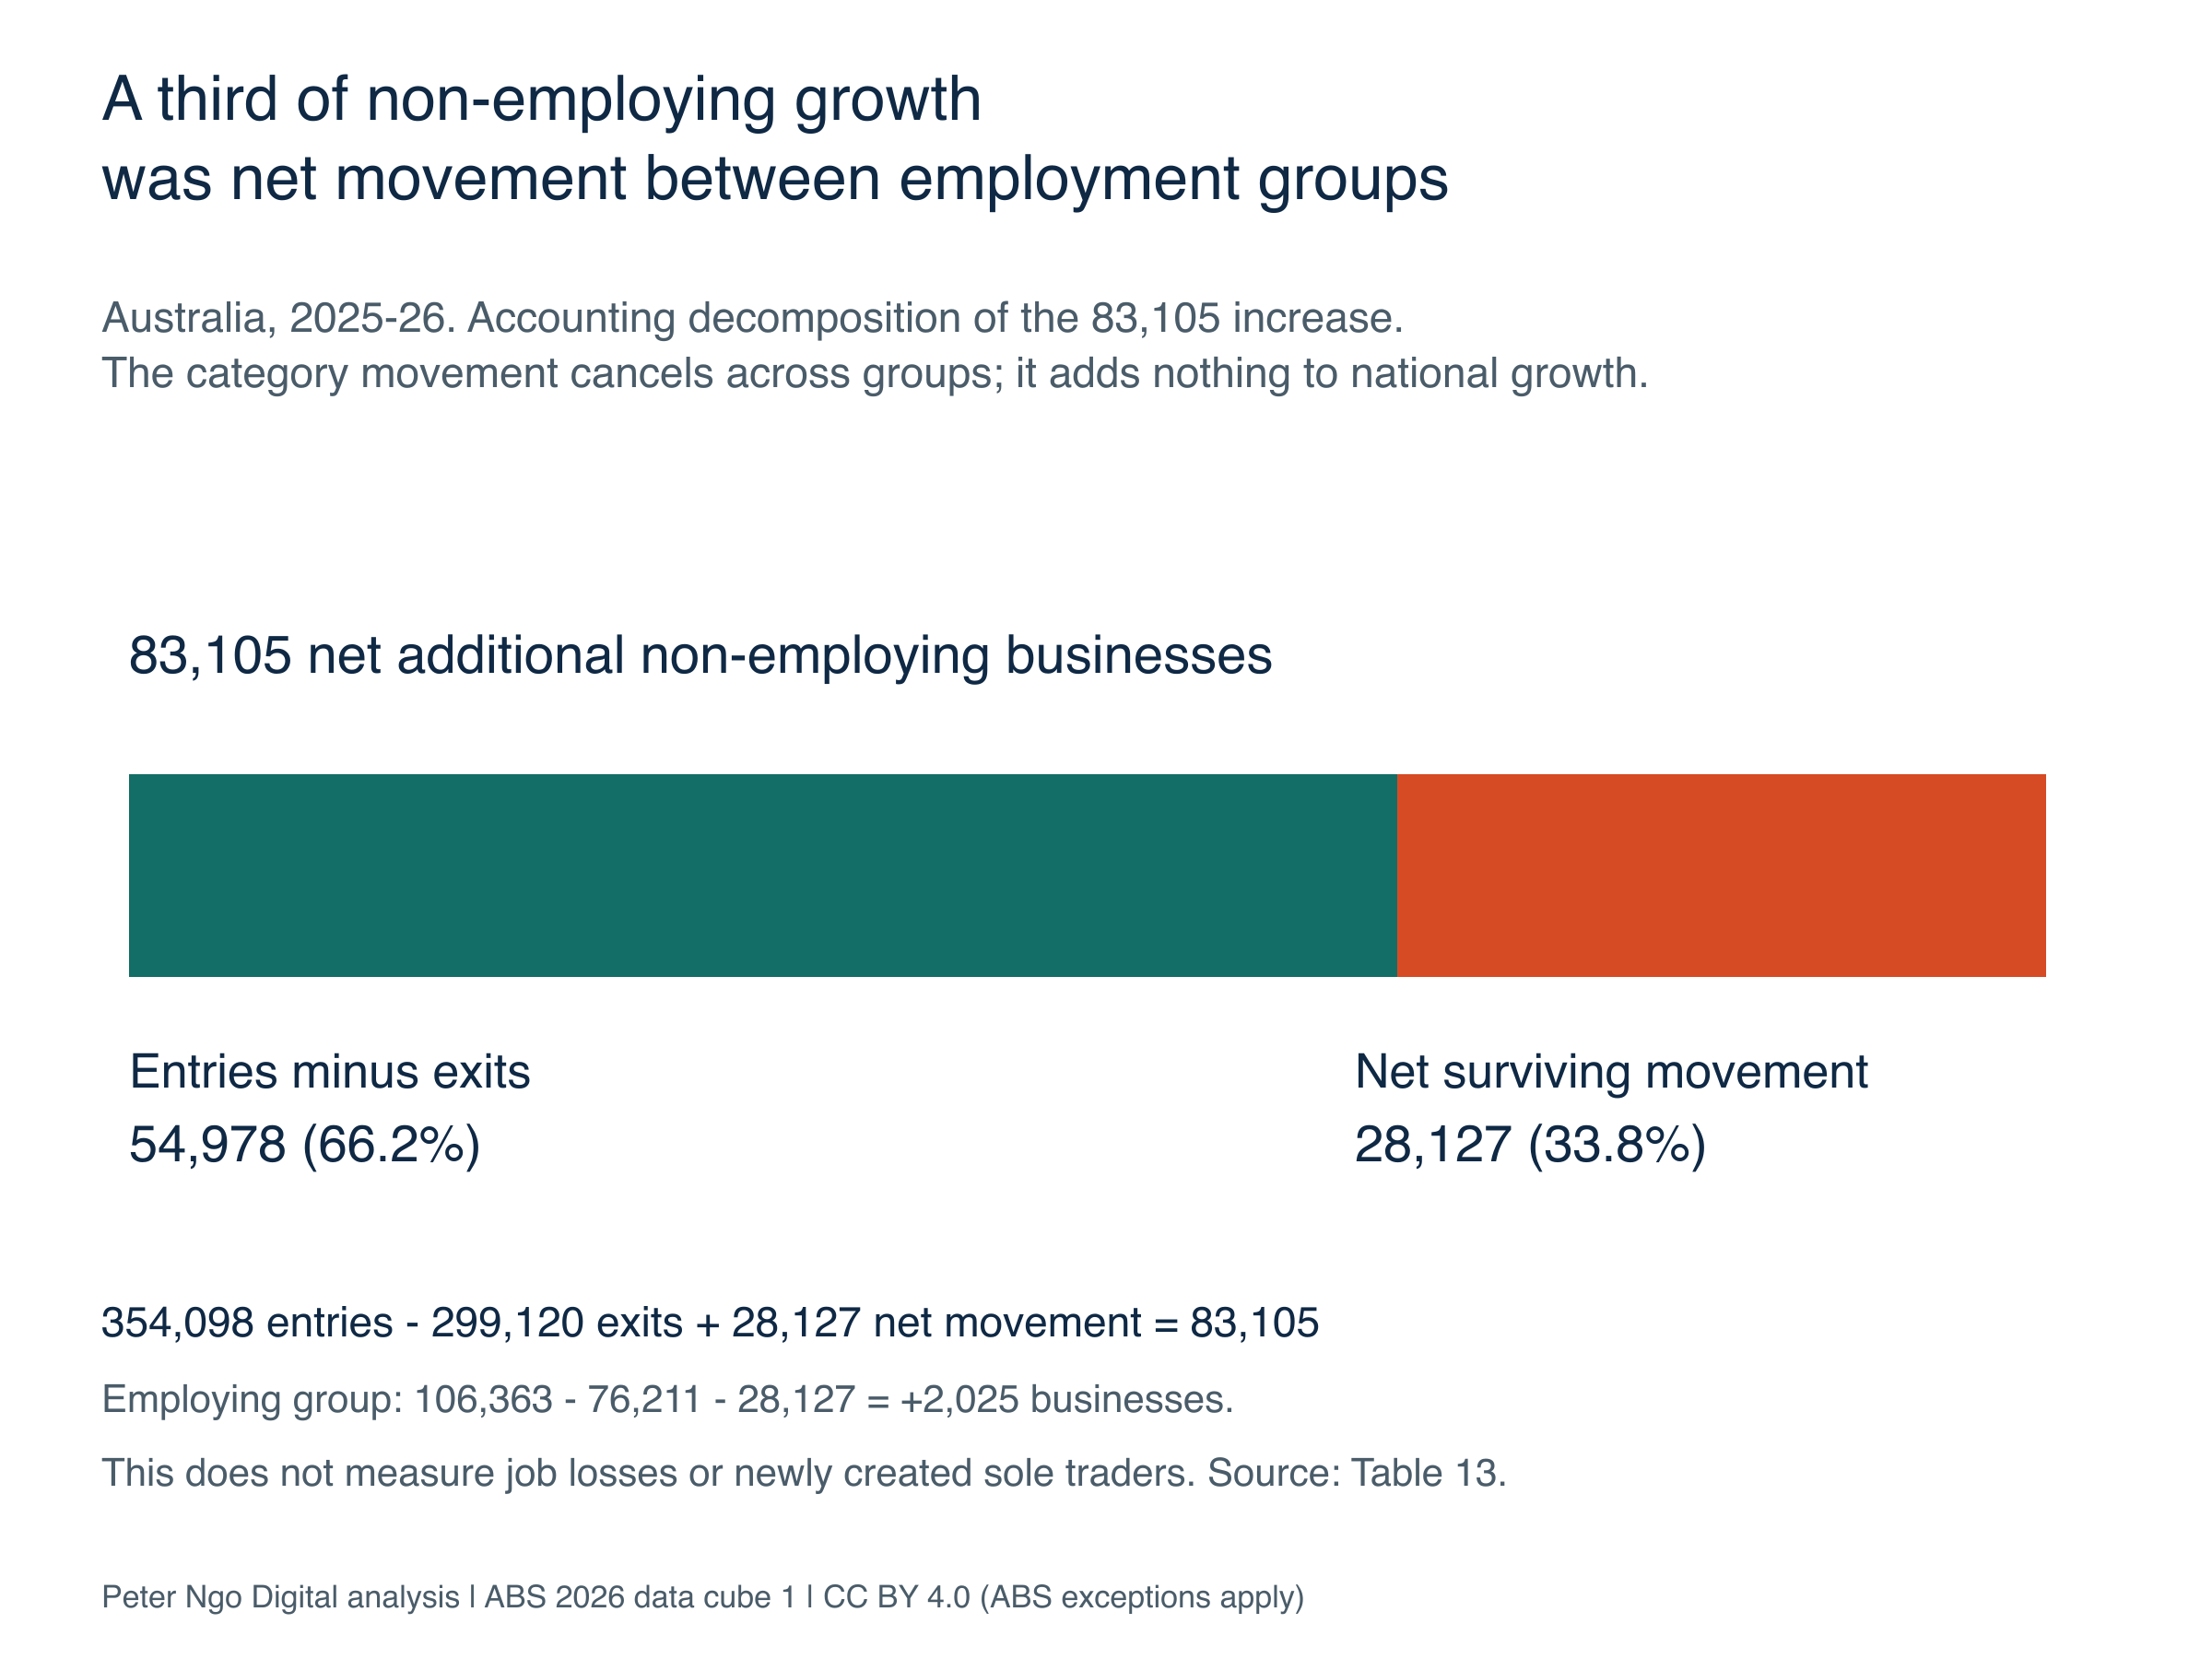
- 2026 employment movement: 33.8% of the non-employing category’s 83,105 increase is net movement of 28,127 surviving businesses from the employing group. That movement cancels nationally. Calculation CSV · Chart SVG · Reference wording.
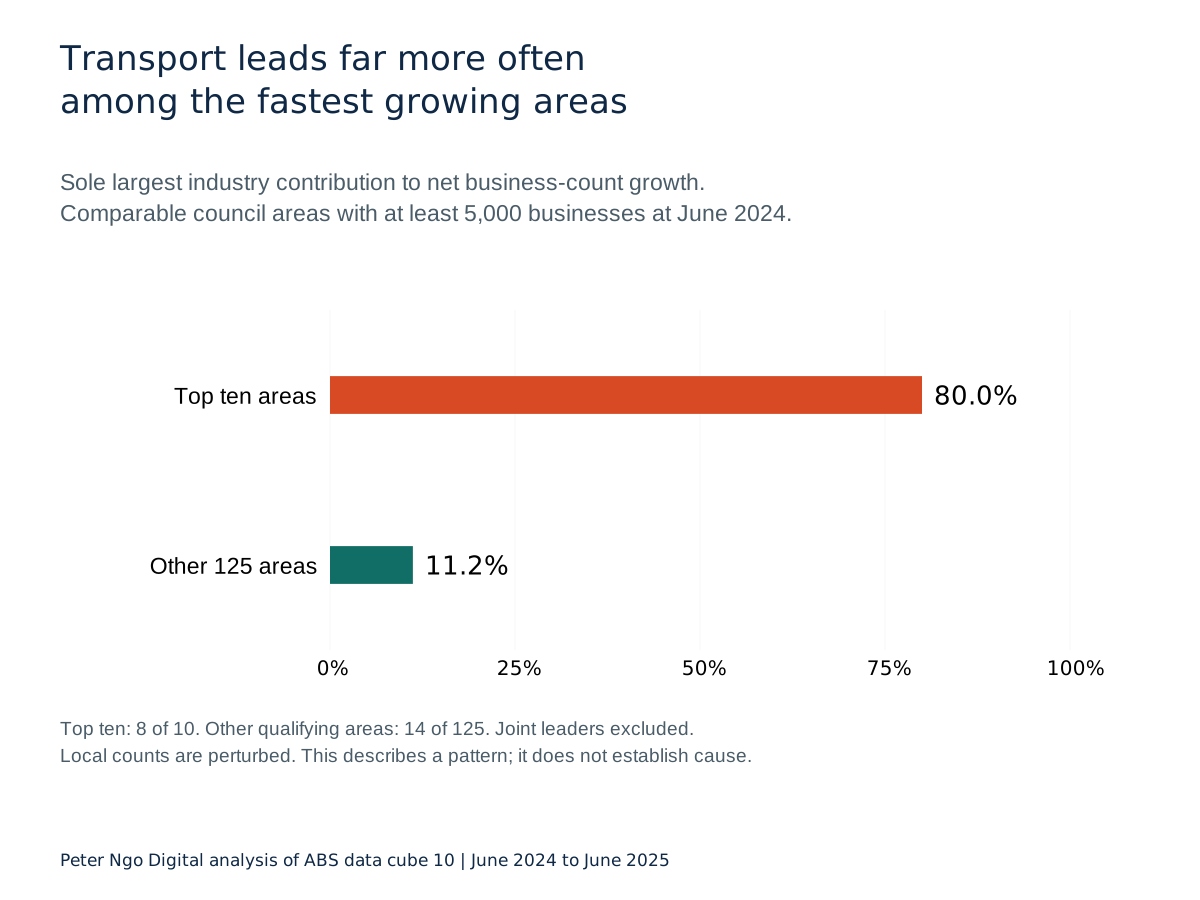
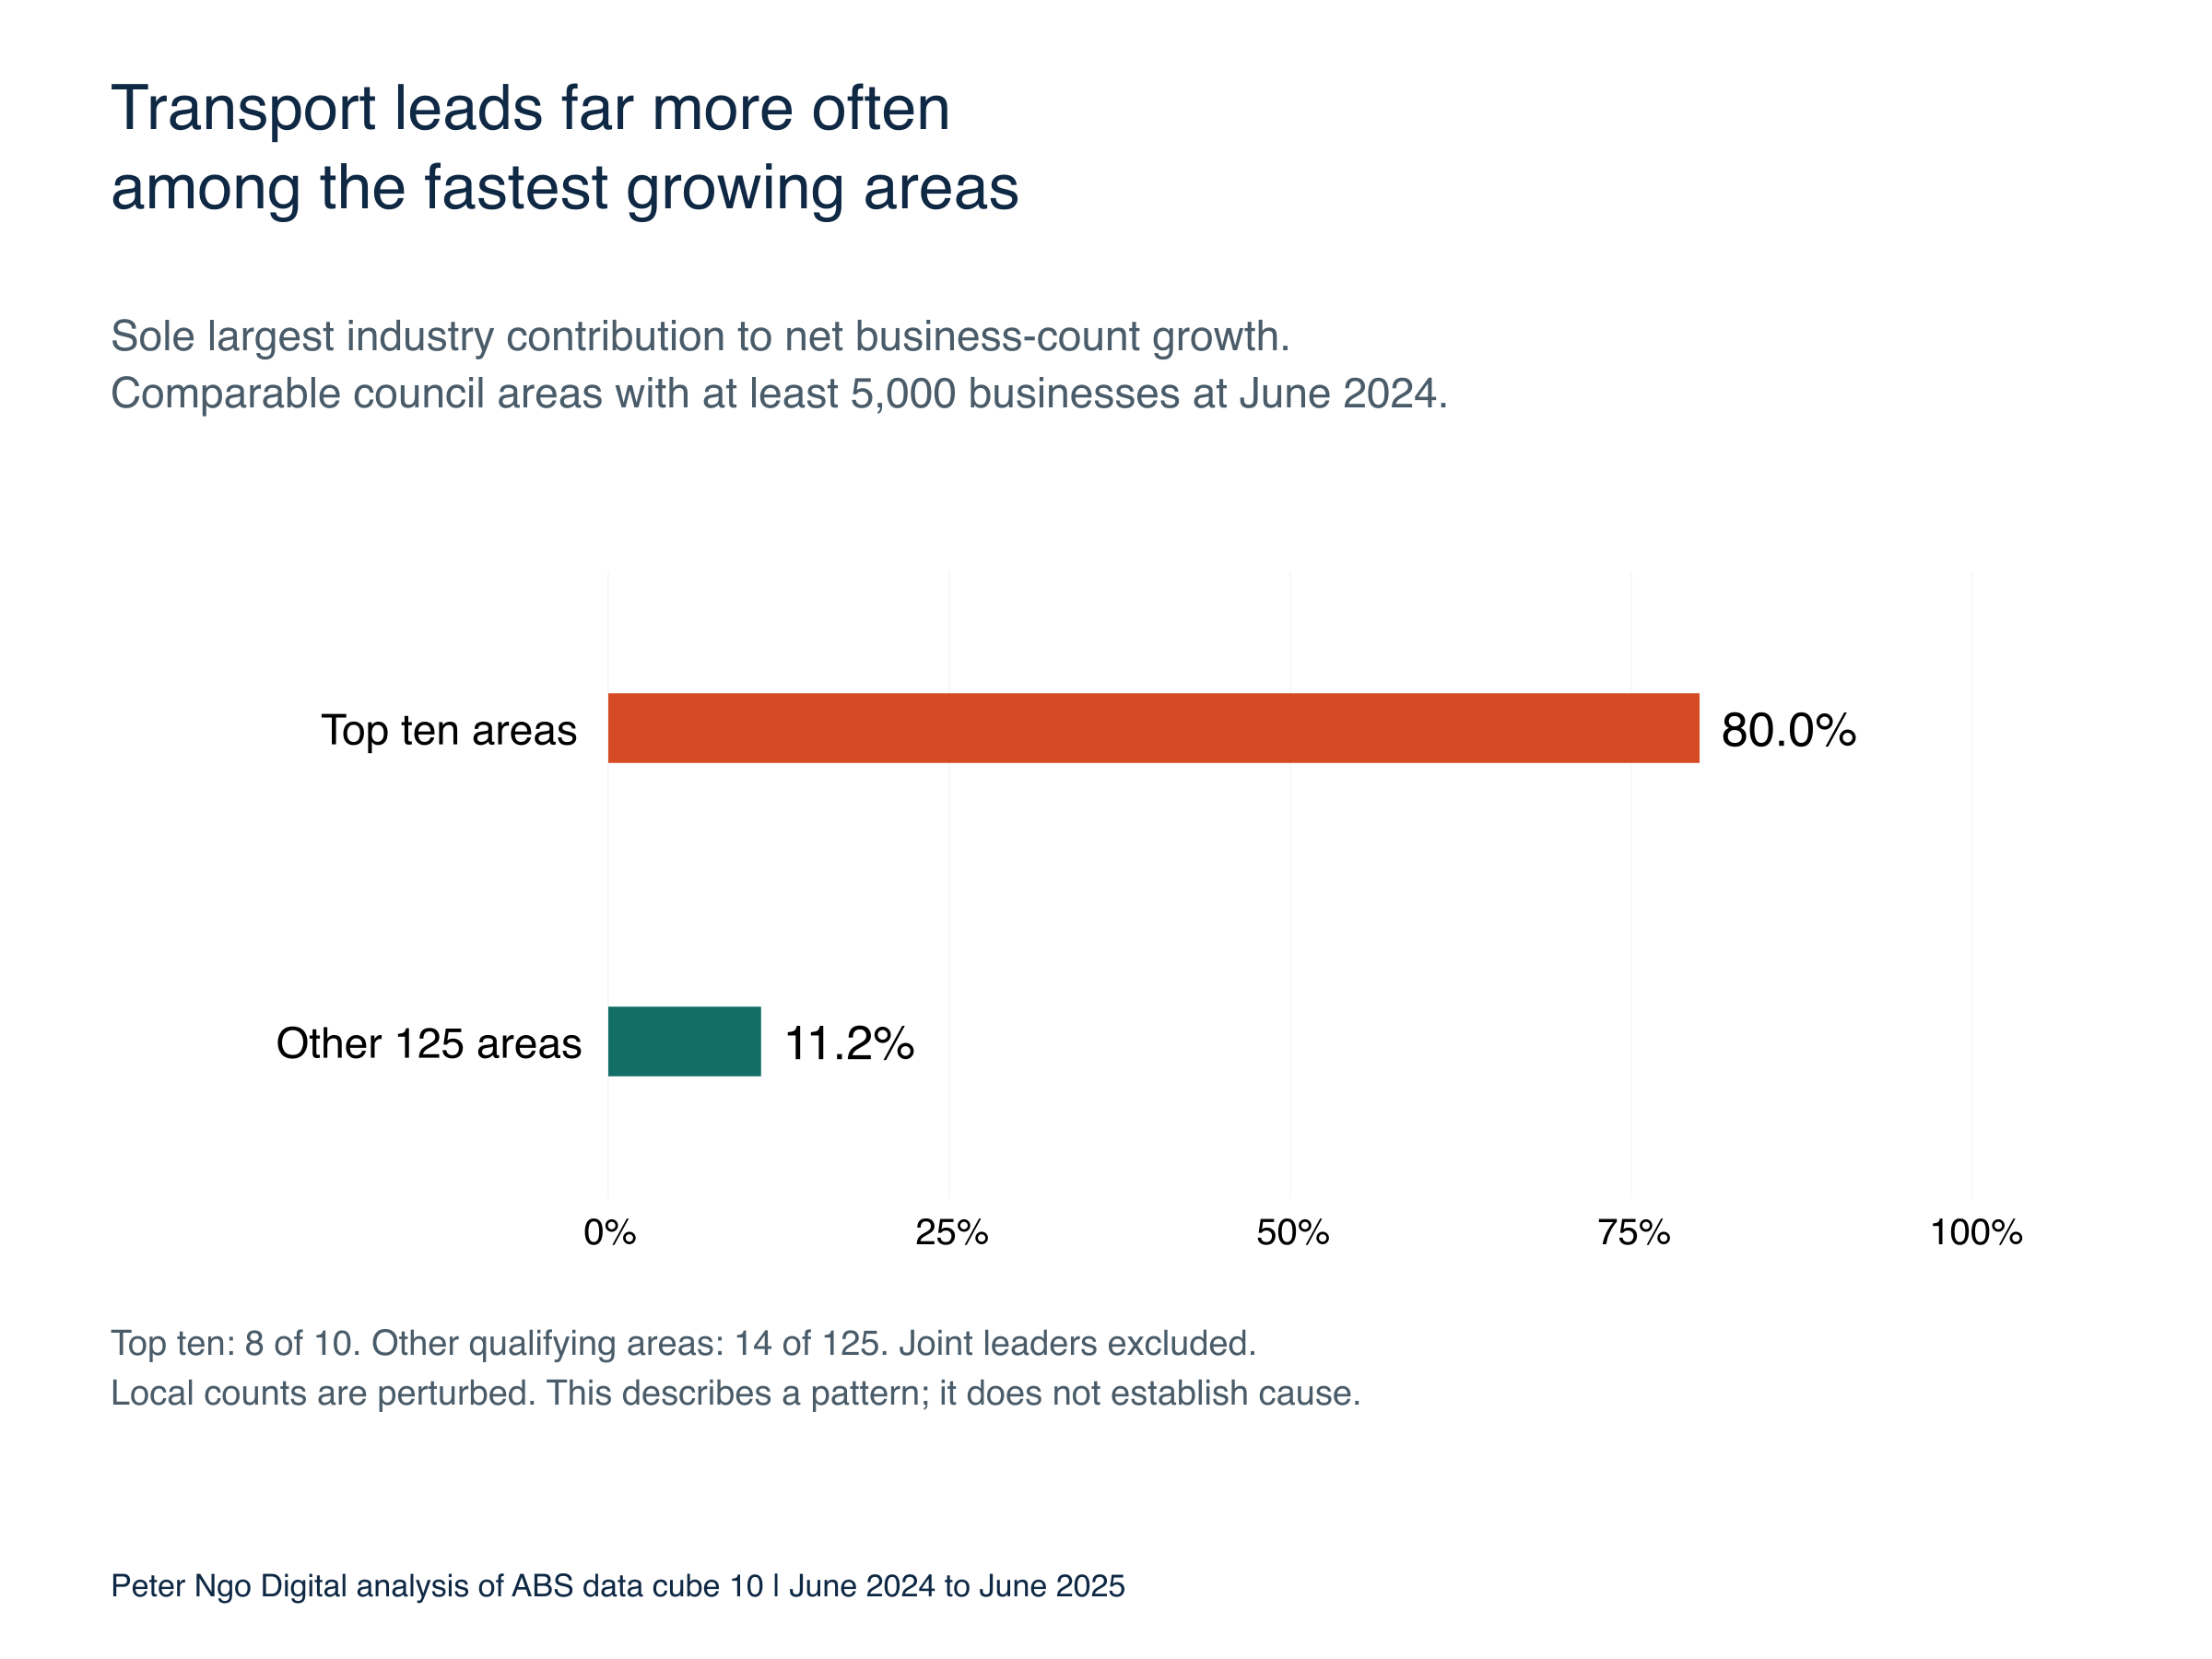
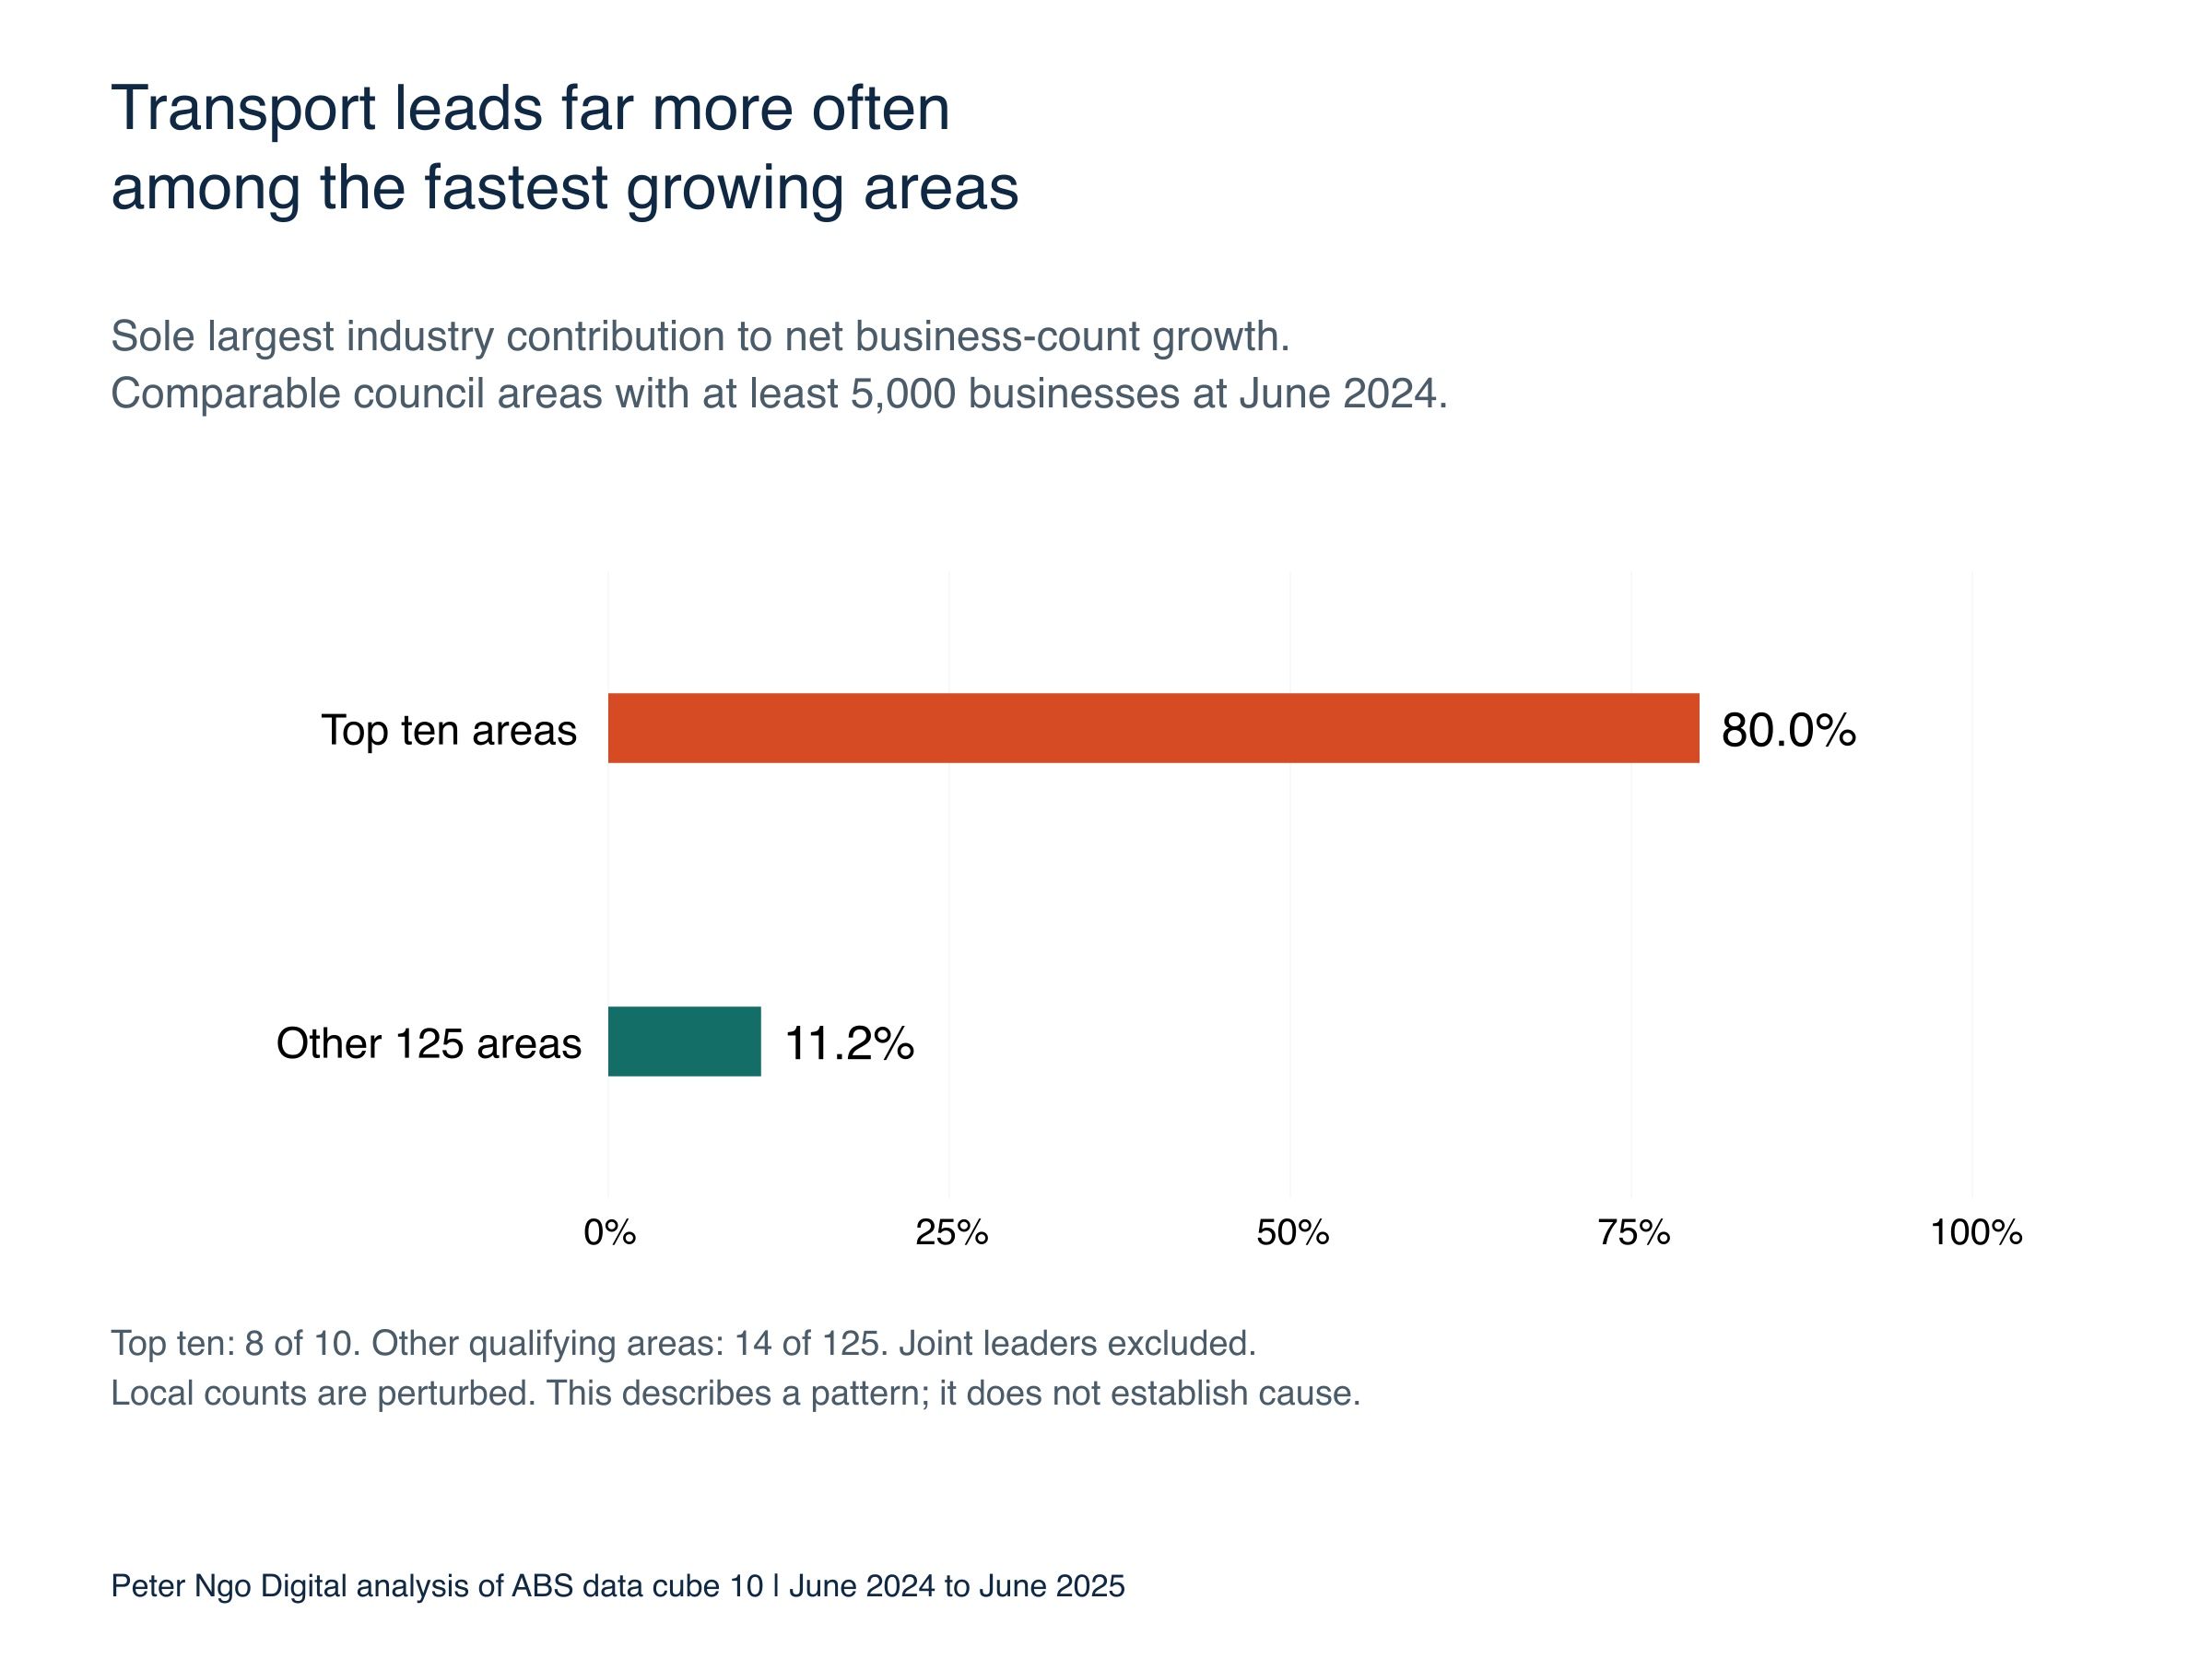
- 2024–25 local concentration: transport was the sole leading industry contributor in 80.0% of the ten fastest growing qualifying councils, versus 11.2% of the other 125. Minimum June 2024 base: 5,000 businesses. Comparison CSV · Chart SVG · Reference wording.
Download the complete journalist pack · Find and export your council’s figures · Check the pickup calculation · Check employment movement · 2026 reference tables · Methods. No email form or registration.
For reporting, you can use the charts and prepared data with credit to Peter Ngo Digital and ABS. Each finding above has a plain text reference with its period, denominator and primary source. Research and correction queries: [email protected].
Where the extra growth came from in 2026
Construction’s annual net increase rose from 10,018 businesses in 2024–25 to 15,603 in 2025–26, a pickup of 5,585. Professional, scientific and technical services rose from 8,663 to 12,804, adding 4,141 to the national pickup. Those two changes sum to 9,726.
Download chart 1 (PNG) · Download chart 1 (SVG). Click the chart to view it at full size.
| Industry / category | Net gain 2024-25 | Net gain 2025-26 | Change in annual net gain |
|---|---|---|---|
| Construction | 10,018 | 15,603 | +5,585 |
| Professional, scientific and technical | 8,663 | 12,804 | +4,141 |
| Other categories, including unknown | 47,969 | 56,723 | +8,754 |
| National total | 66,650 | 85,130 | +18,480 |
The remaining industries and the unknown category account for 8,754 of the pickup. All 19 industry changes plus the unknown category reconcile to 18,480. The full comparison CSV retains each year’s opening and closing counts, net change, rate and original cells, so you can check the calculation rather than take the headline on trust.
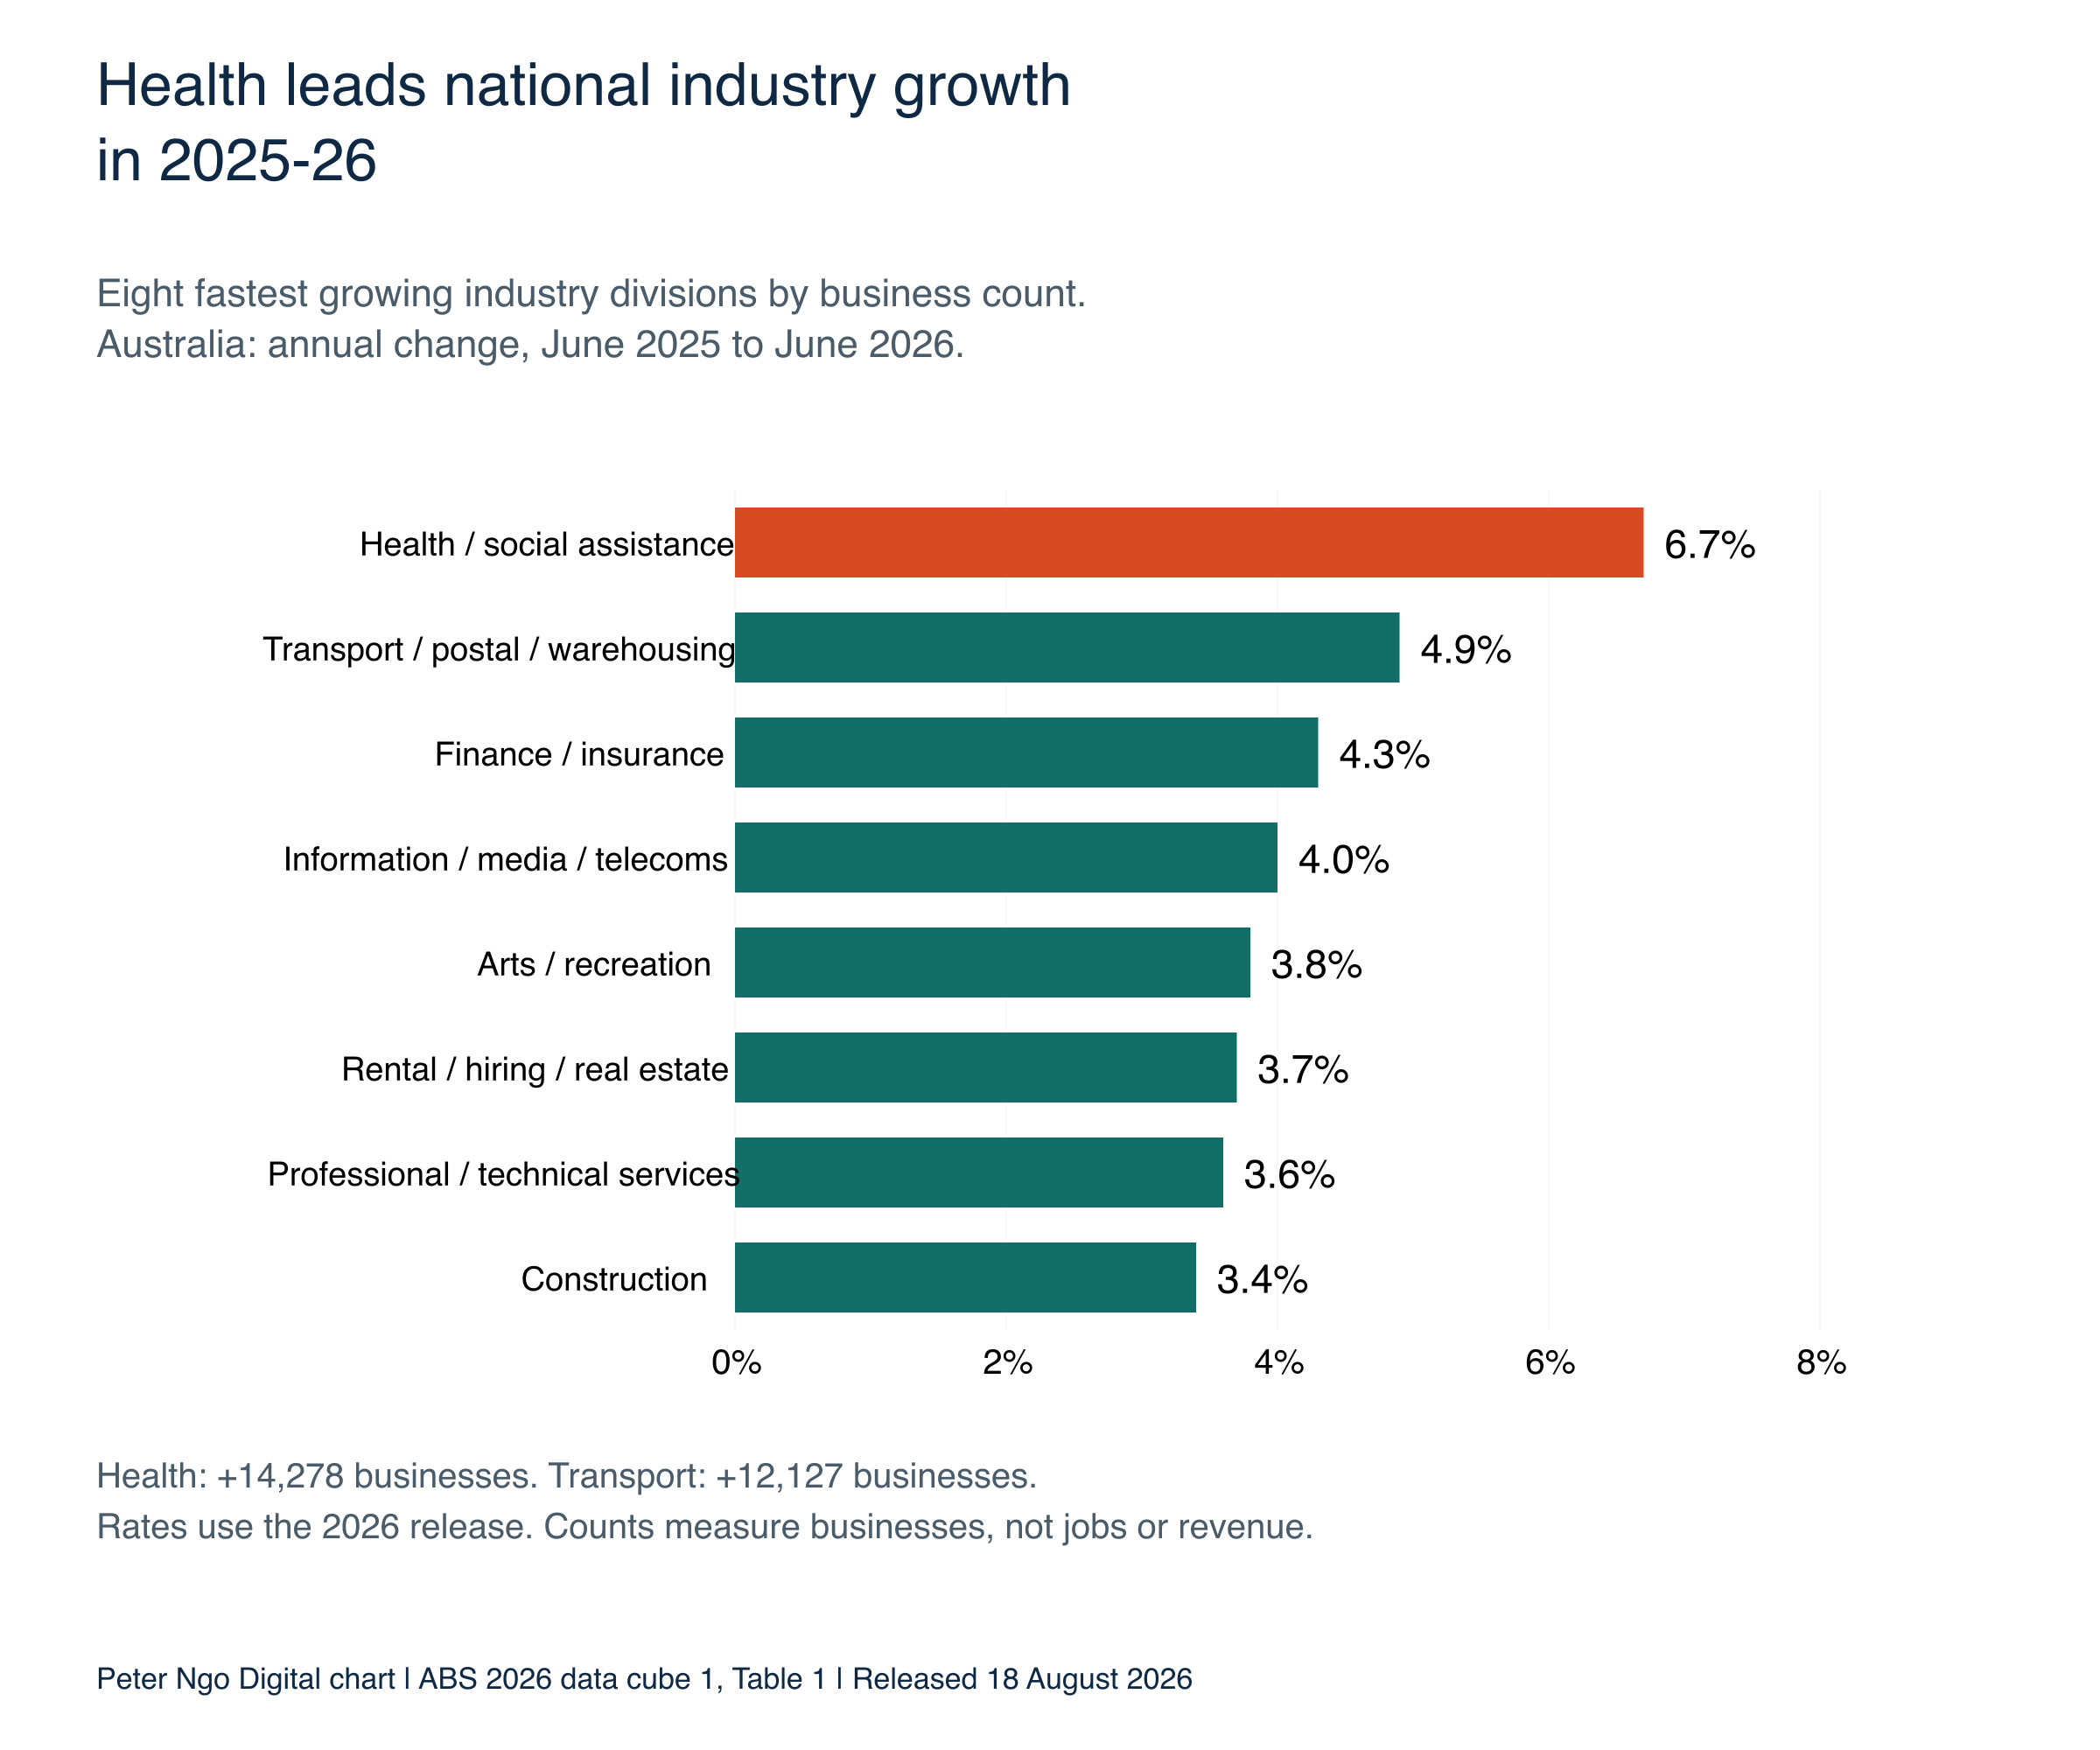
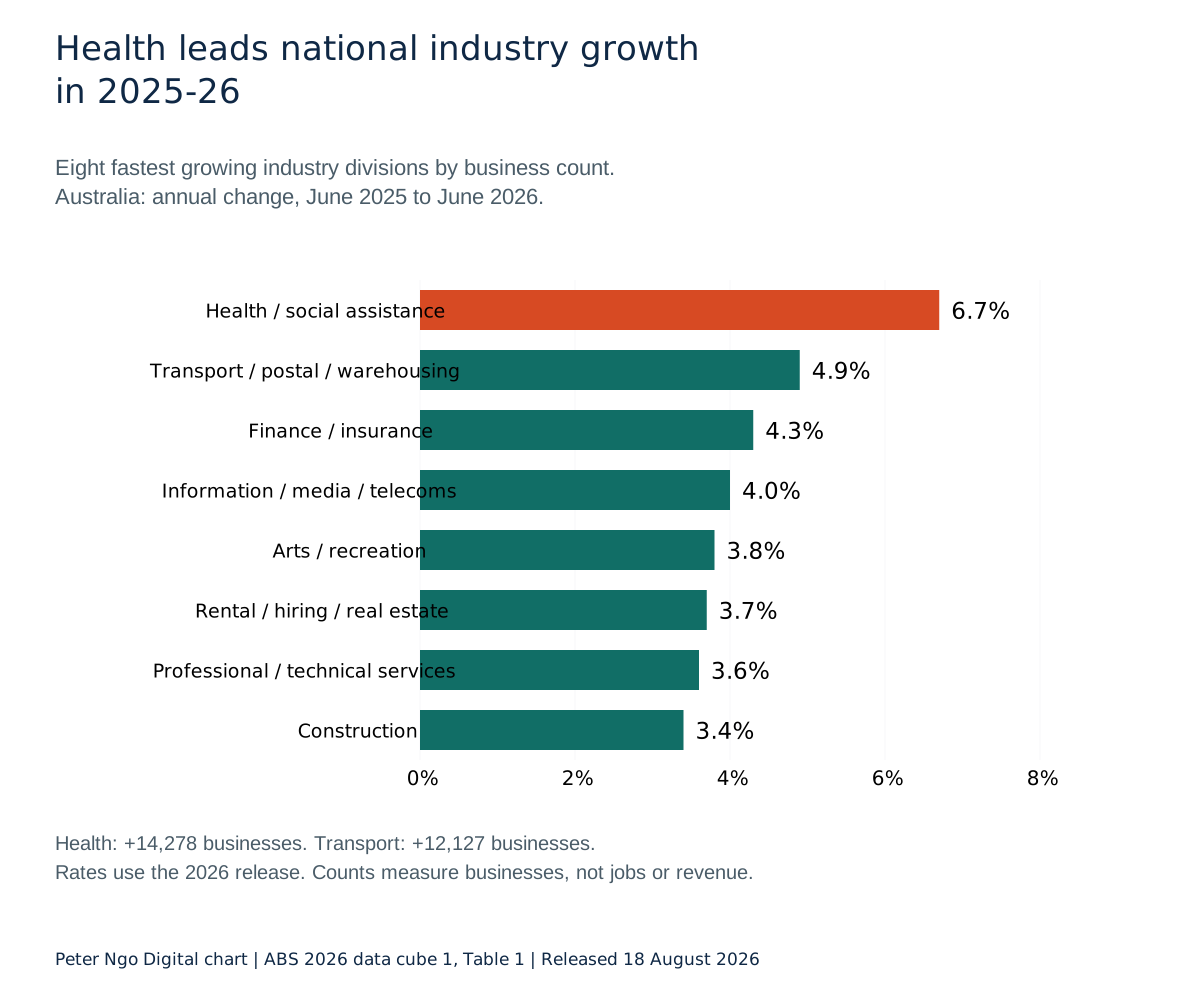
This is a different ranking from the fastest annual growth rate. Health care and social assistance still grew fastest in 2025–26 at 6.7%, but its annual net gain improved by 1,055. Transport remained second fastest at 4.9%, while its annual net gain improved by just 152. A large existing growth rate does not necessarily mean a large new contribution to the pickup.
There is another useful distinction in the file: information, media and telecommunications had the largest acceleration in its count-derived annual growth rate, approximately 2.47 percentage points. I calculate that comparison from unrounded counts. Seventeen divisions accelerated and two slowed slightly; rounding both years to one decimal can hide small changes. None of these measures establishes revenue, jobs or why businesses entered an industry.
Why the non-employing increase is not a count of new sole traders
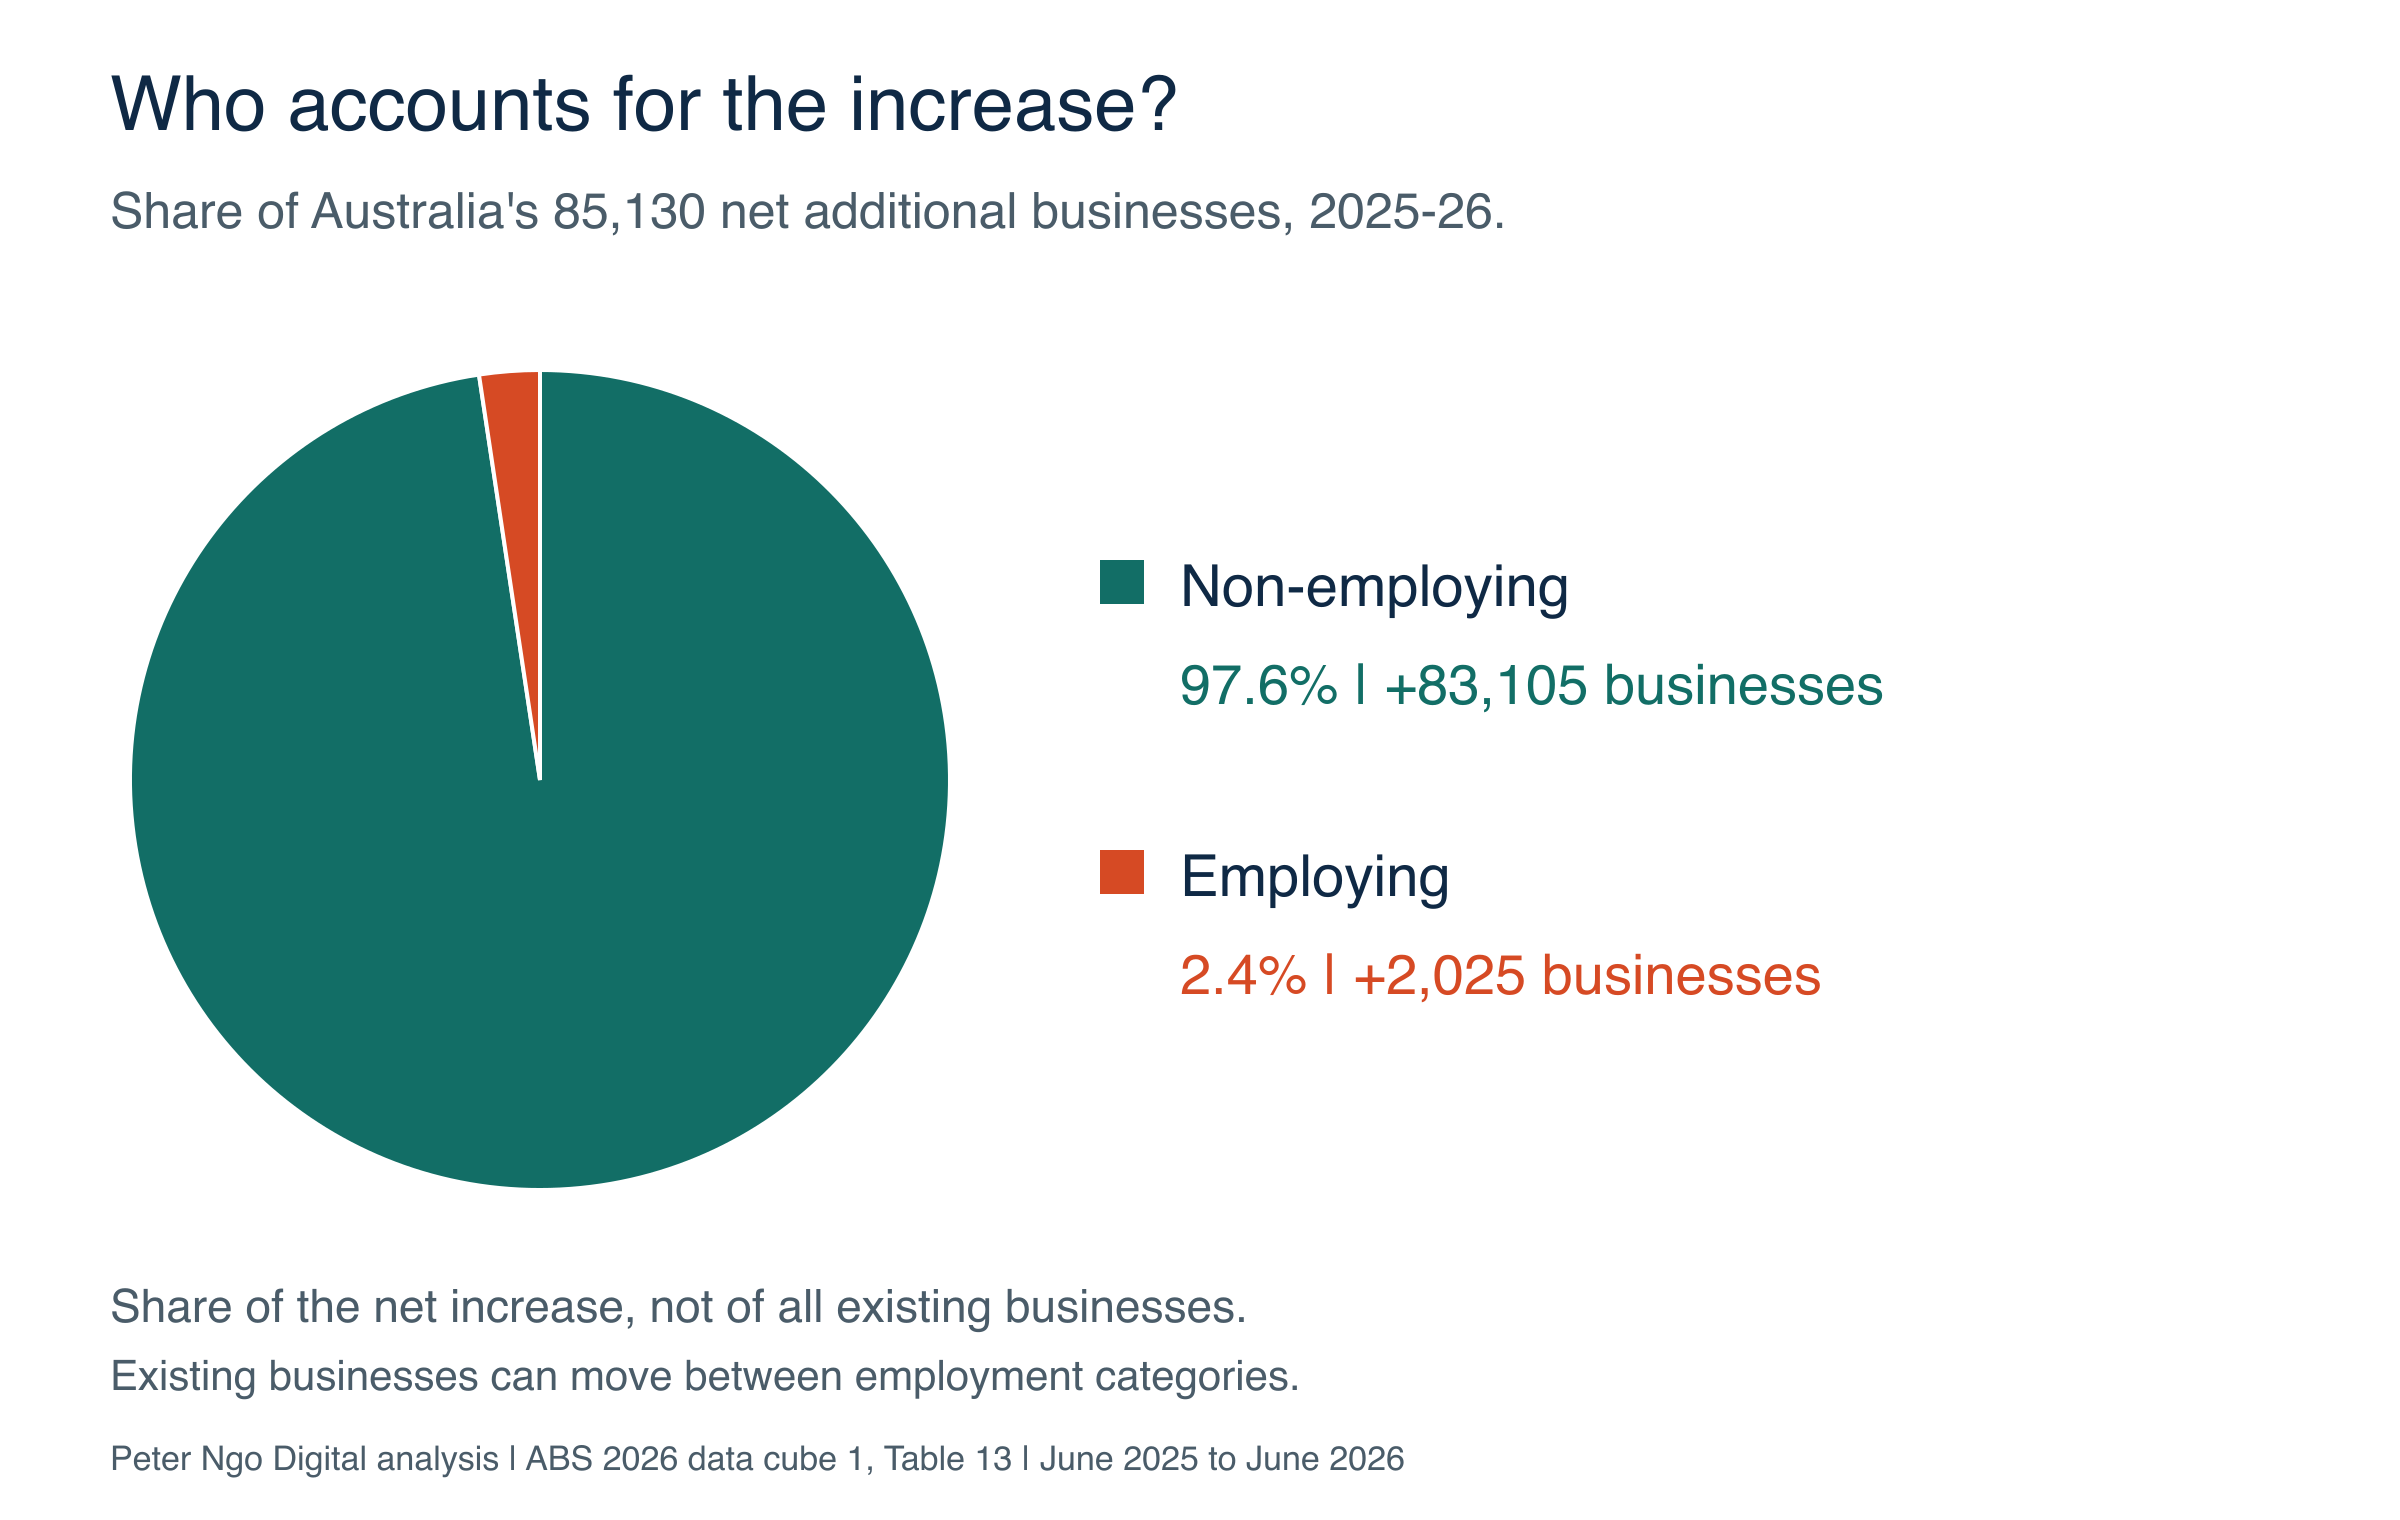
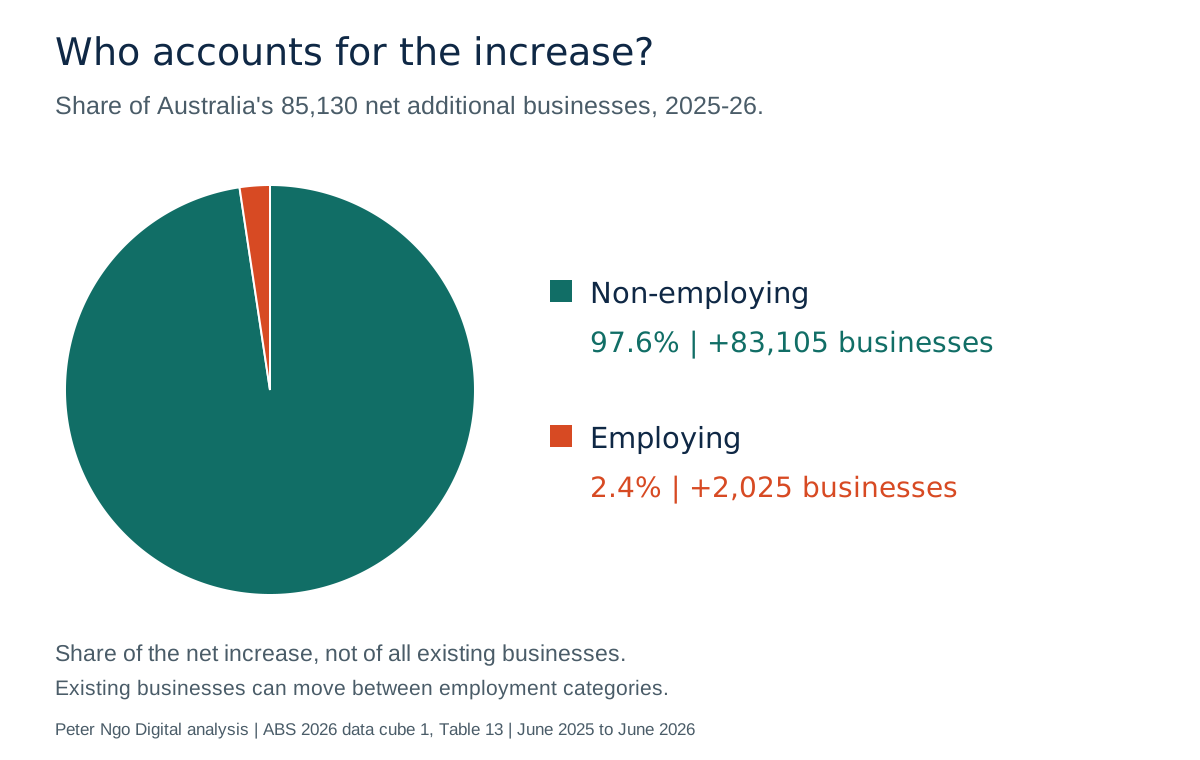
The non-employing category increased by 83,105 businesses. Its entries exceeded exits by 54,978, and net movement of 28,127 surviving businesses from employing to non-employing accounts for the remaining 33.8%. That is an accounting decomposition of this category, rather than an explanation of the owners’ decisions.
Download chart 2 (PNG) · Download chart 2 (SVG). Click the chart to view it at full size.
| Employment group | Entries | Exits | Entries less exits | Net surviving movement | Net increase |
|---|---|---|---|---|---|
| Non-employing | 354,098 | 299,120 | 54,978 | +28,127 | +83,105 |
| Total employing | 106,363 | 76,211 | 30,152 | -28,127 | +2,025 |
The employing group shows the other side. Entries less exits produced a balance of 30,152, then net movement of 28,127 into the non-employing group left an increase of 2,025. Across both groups, the movements cancel and the national net increase is still 85,130.
I would keep that identity beside the widely reported 97.6% non-employing share of national net growth. The share describes where the increase sits; it does not mean 97.6% of new startups were sole traders. Employment categories can lag the count date, and this table does not tell us how many jobs were created or lost. Download both sides of the calculation.
Latest council detail: transport led eight of ten growth hotspots in 2024–25
The 2026 state and industry reference figures cannot update individual council rankings. For local detail, I analysed the latest available council tables, covering June 2024 to June 2025. Of 536 comparable council areas, 135 had at least 5,000 businesses at June 2024. The main ranking uses annual percentage growth within that group.
Transport, postal and warehousing was the sole largest industry contributor to business count growth in eight of the top ten, or 80%. Across the other 125 qualifying areas, it led in 14, or 11.2%. That concentration is a local historical finding. It does not establish why those areas grew or whether transport led them in 2026.
Download chart 3 (PNG) · Download chart 3 (SVG). Click the chart to view it at full size.
| Group | Areas | Transport sole leaders | Share |
|---|---|---|---|
| Top ten | 10 | 8 | 80.0% |
| Other qualifying areas | 125 | 14 | 11.2% |
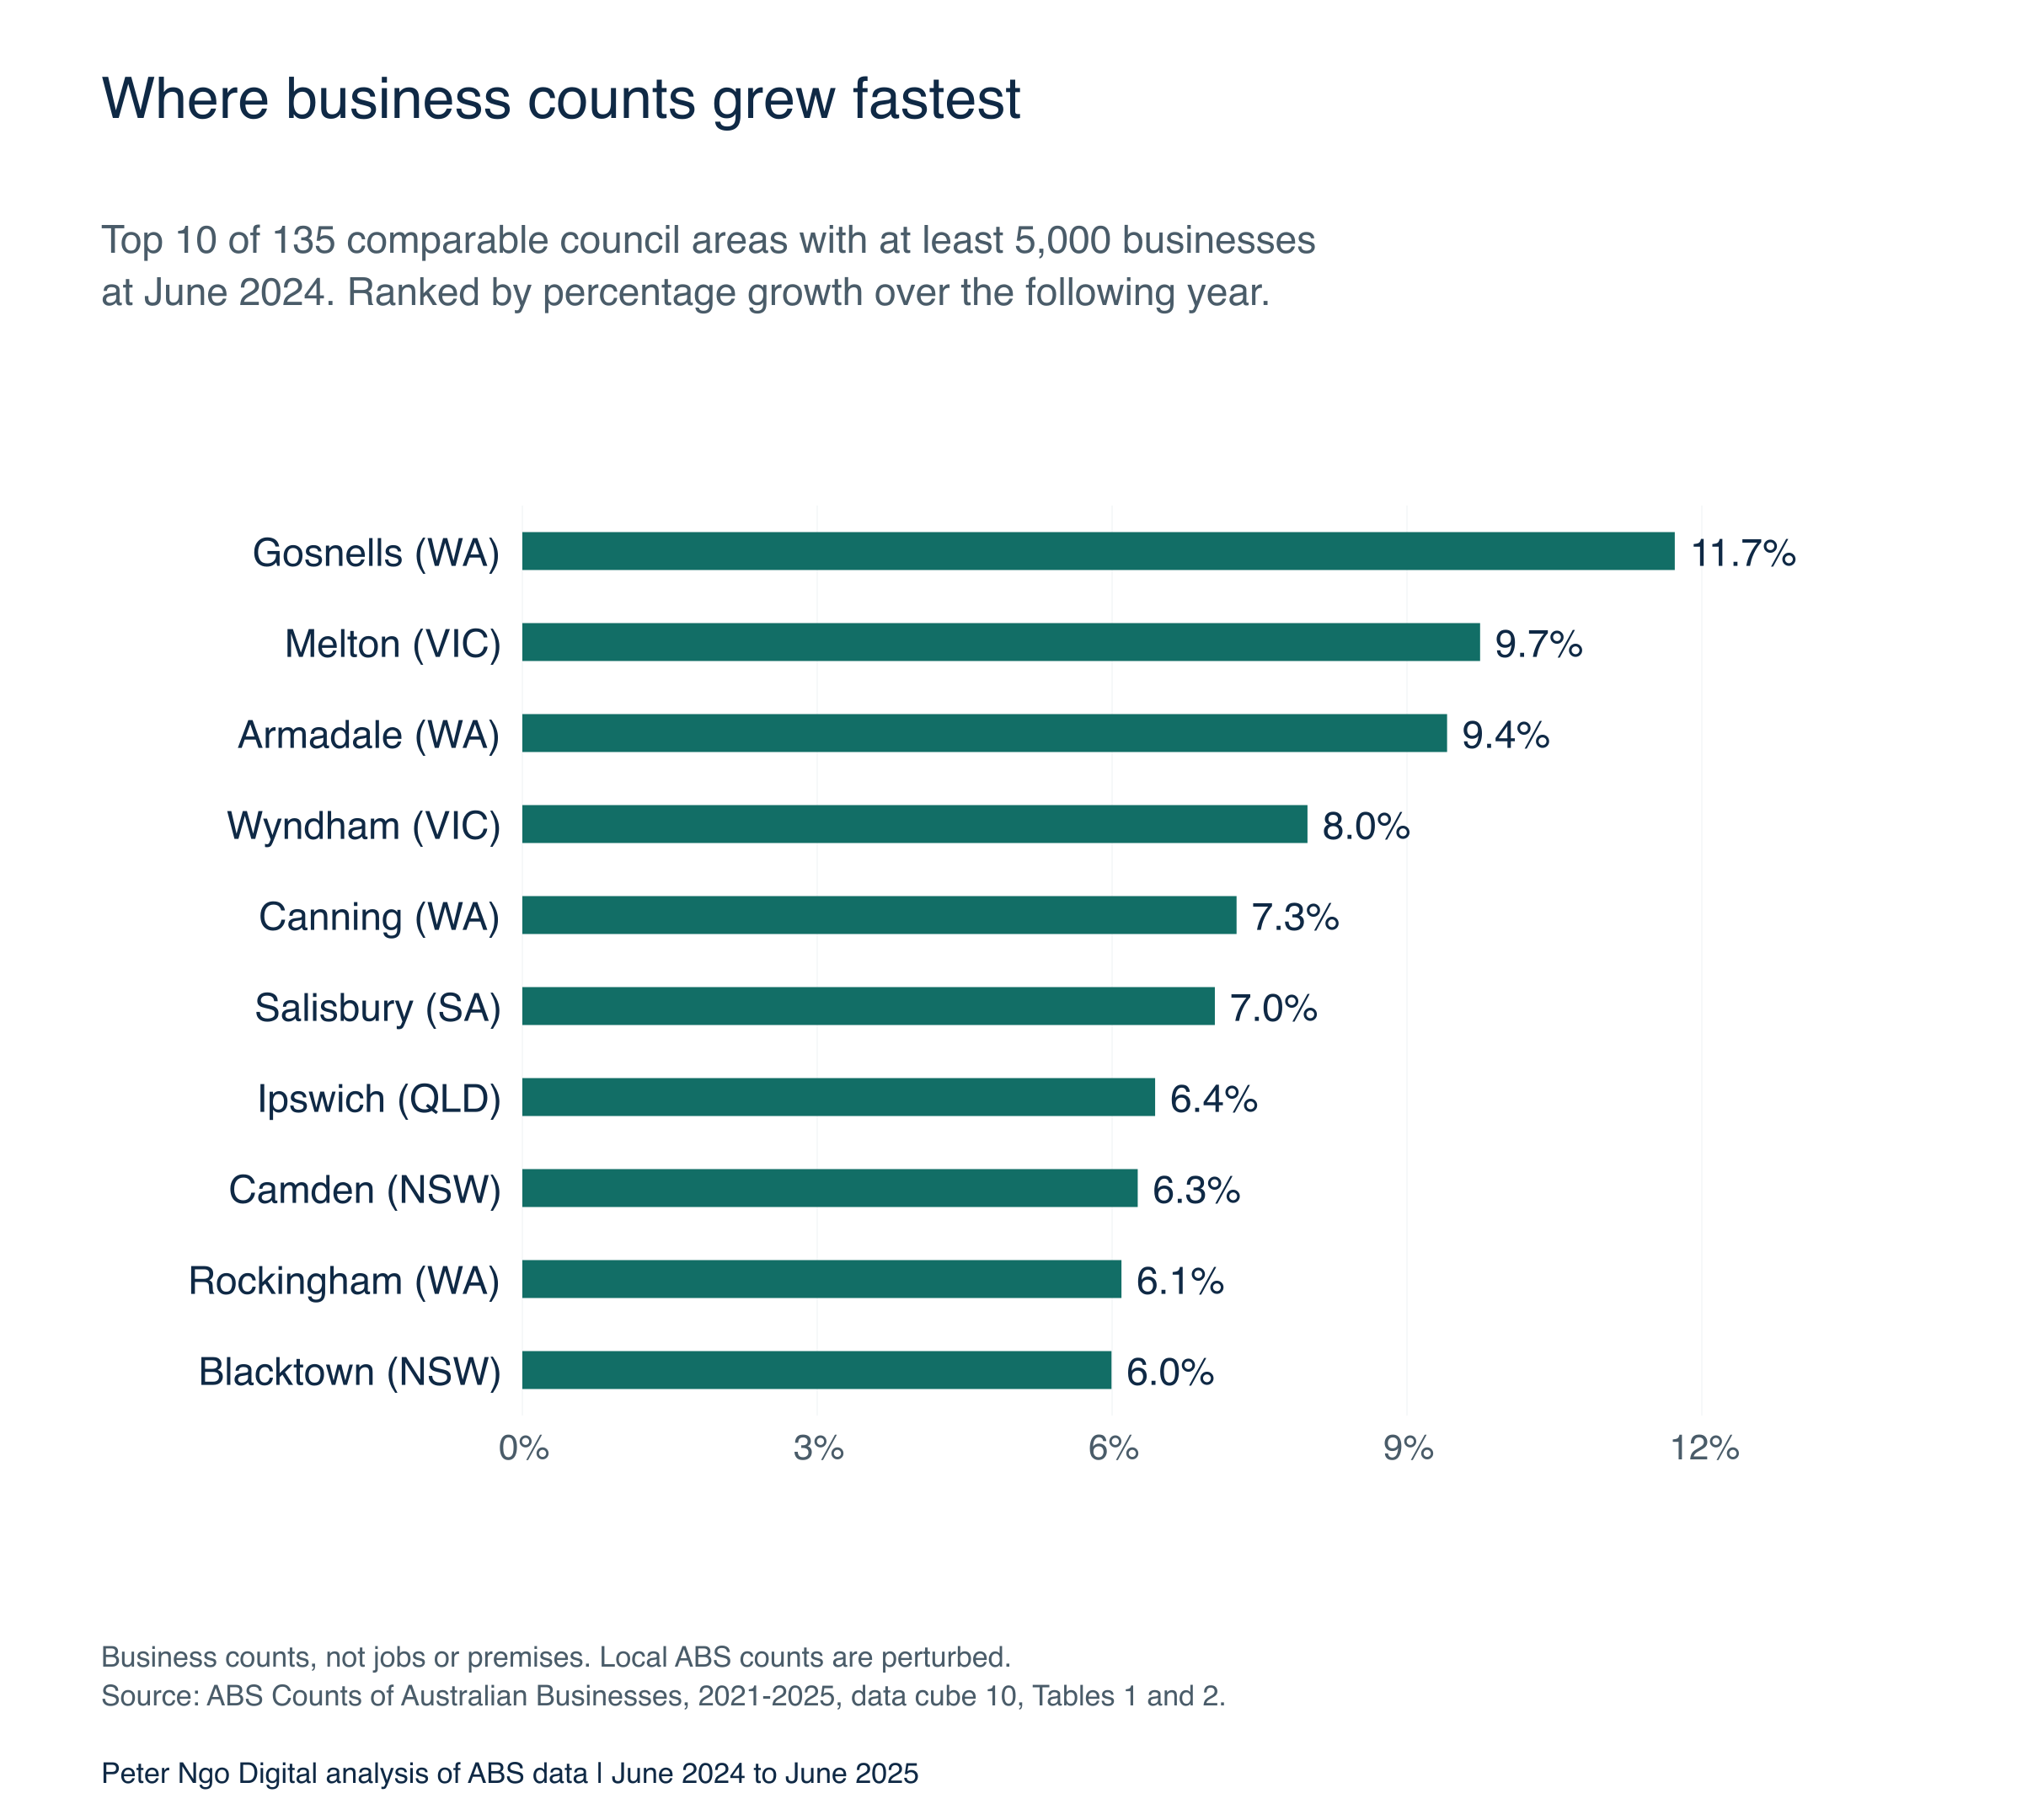
The top ten qualifying councils, June 2024 to June 2025
Download chart 4 (PNG) · Download chart 4 (SVG). Click the chart to view it at full size.
| Council area | June 2024 | June 2025 | Net increase | Growth | Leading industry |
|---|---|---|---|---|---|
| Gosnells, WA | 9,834 | 10,987 | +1,153 | 11.7% | Transport |
| Melton, VIC | 17,303 | 18,989 | +1,686 | 9.7% | Transport |
| Armadale, WA | 6,420 | 7,024 | +604 | 9.4% | Transport |
| Wyndham, VIC | 34,878 | 37,664 | +2,786 | 8.0% | Transport |
| Canning, WA | 11,450 | 12,282 | +832 | 7.3% | Transport |
| Salisbury, SA | 9,893 | 10,590 | +697 | 7.0% | Transport |
| Ipswich, QLD | 13,048 | 13,888 | +840 | 6.4% | Transport |
| Camden, NSW | 11,021 | 11,711 | +690 | 6.3% | Health / social assistance |
| Rockingham, WA | 6,218 | 6,597 | +379 | 6.1% | Construction |
| Blacktown, NSW | 33,868 | 35,898 | +2,030 | 6.0% | Transport |
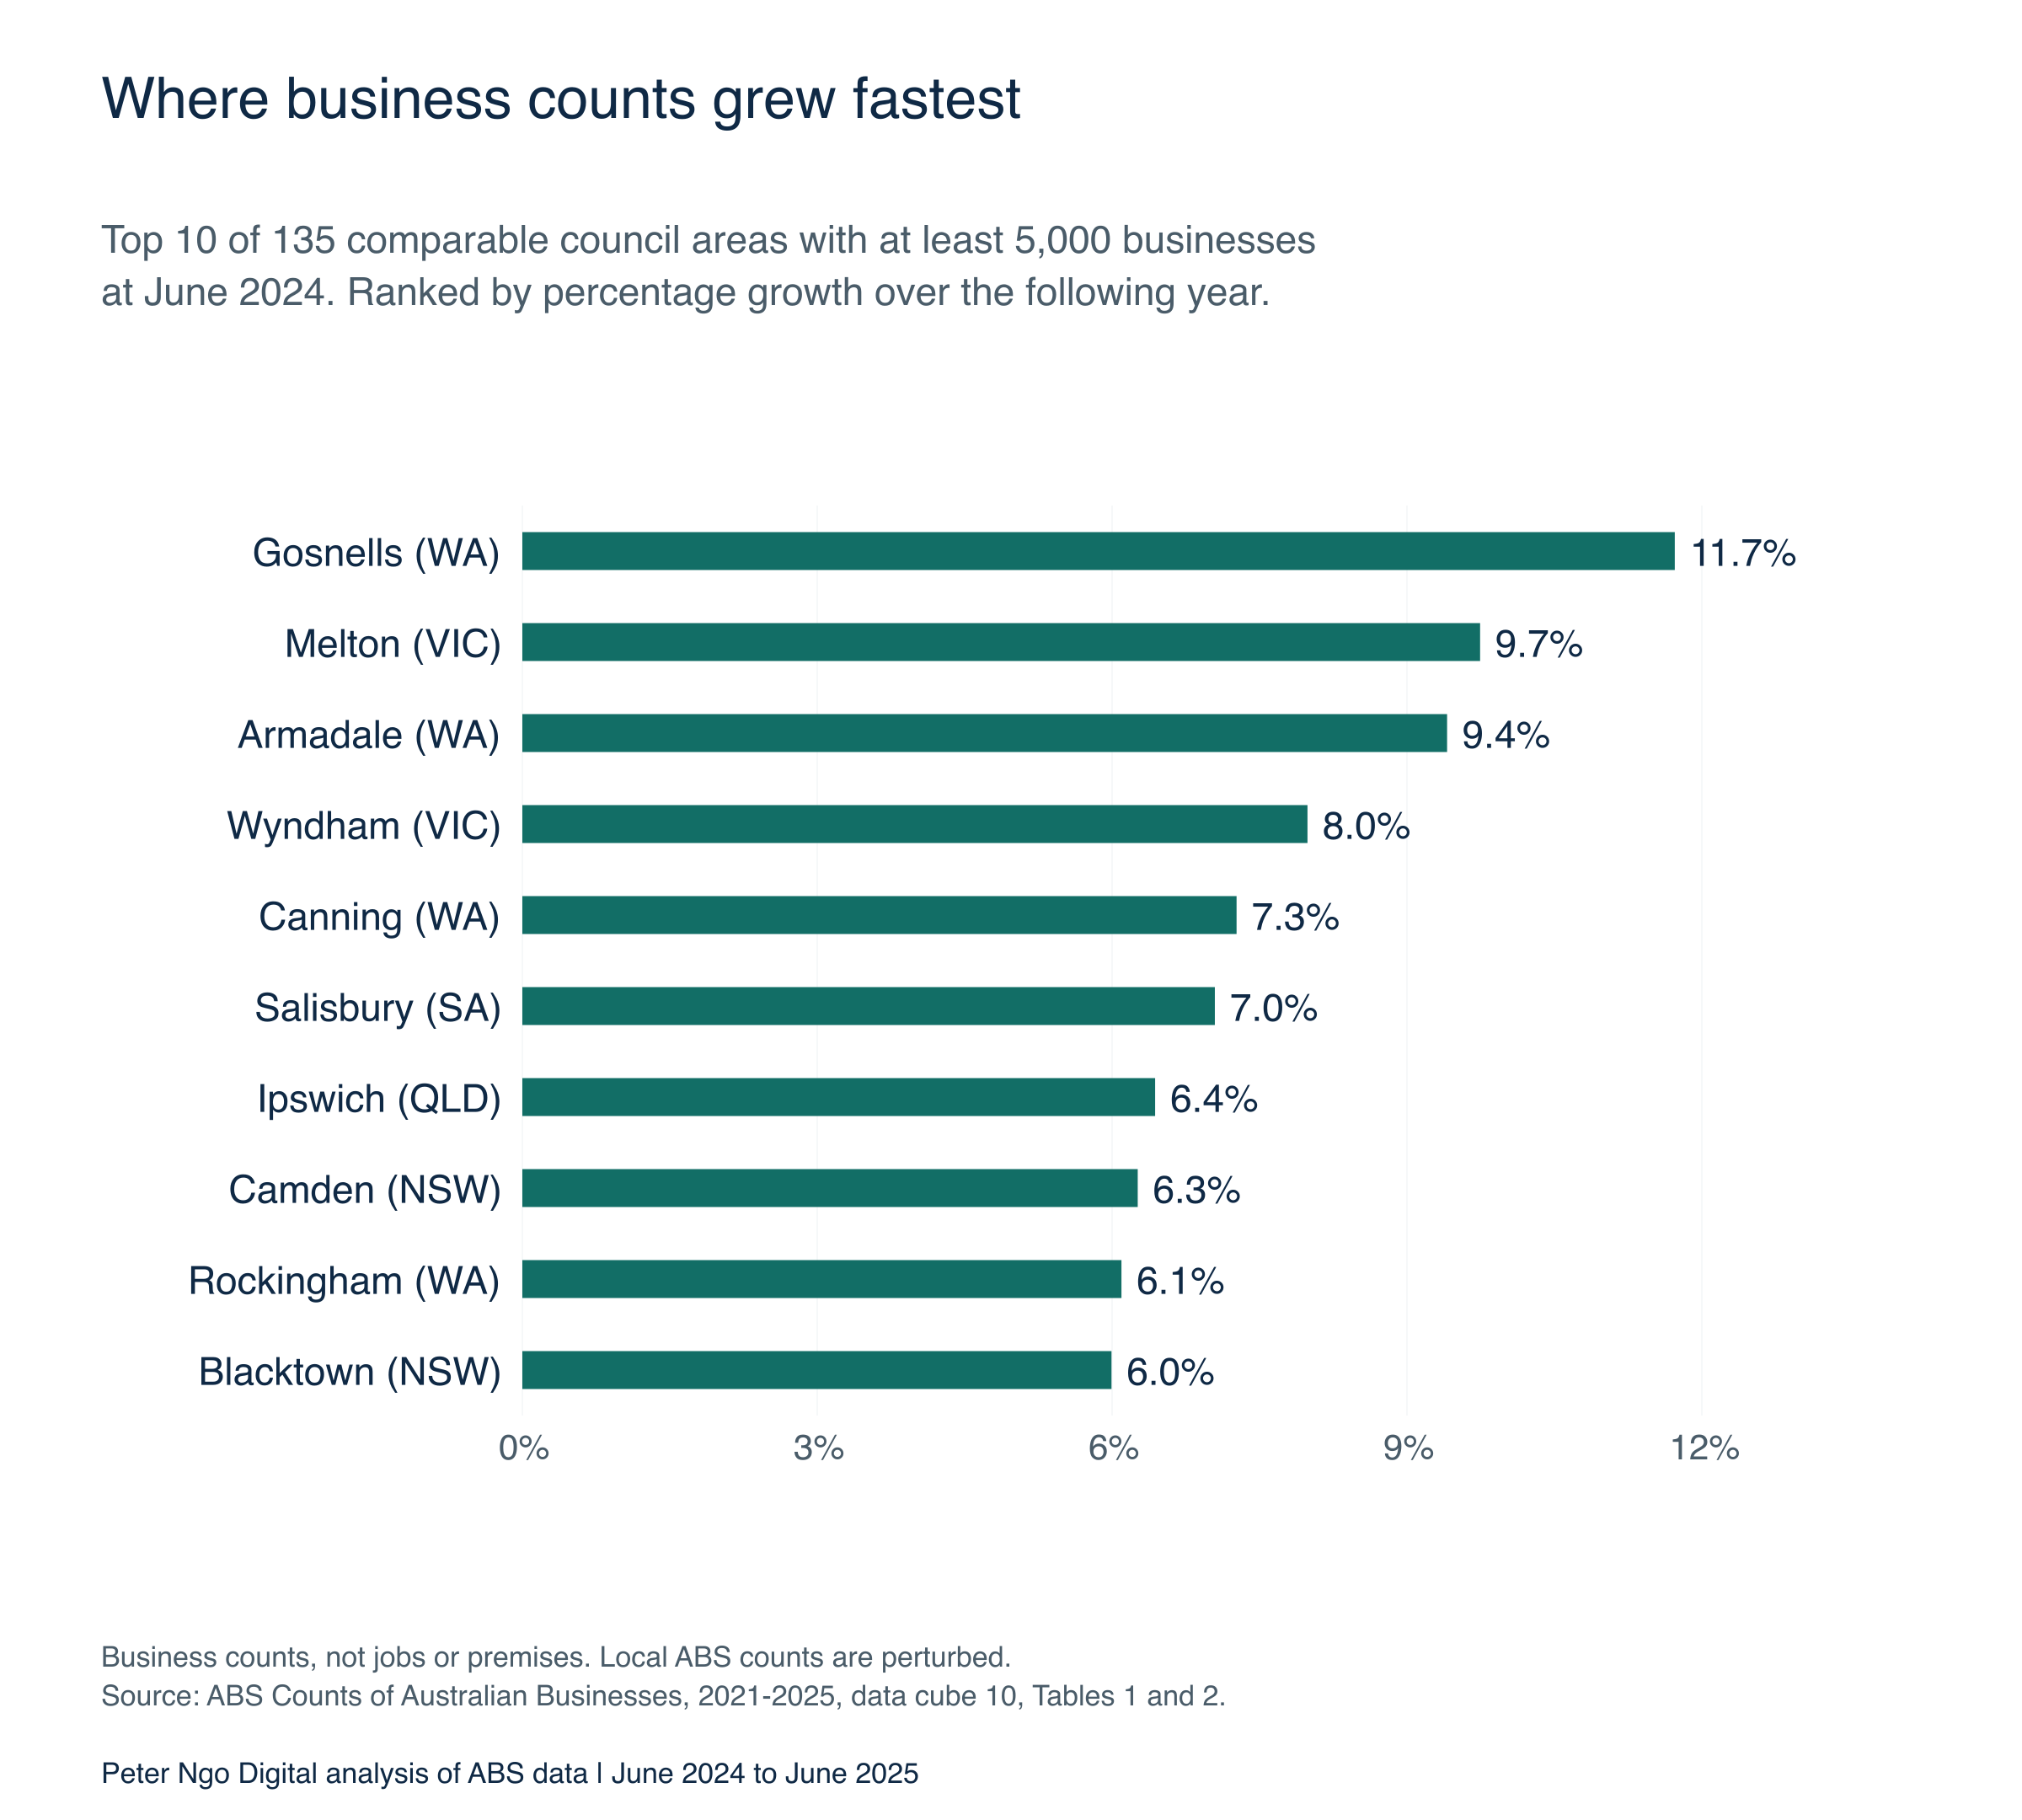
Gosnells leads the qualifying rate ranking at 11.7%, followed by Melton at 9.7% and Armadale at 9.4%. Brisbane had the largest numerical increase among all 536 comparable areas, adding 3,354 businesses, or 2.4%, from a starting base of 142,562. Council boundaries differ substantially: Brisbane council is not Greater Brisbane, just as Sydney council is not Greater Sydney.
Where transport contributed most in the earlier local data
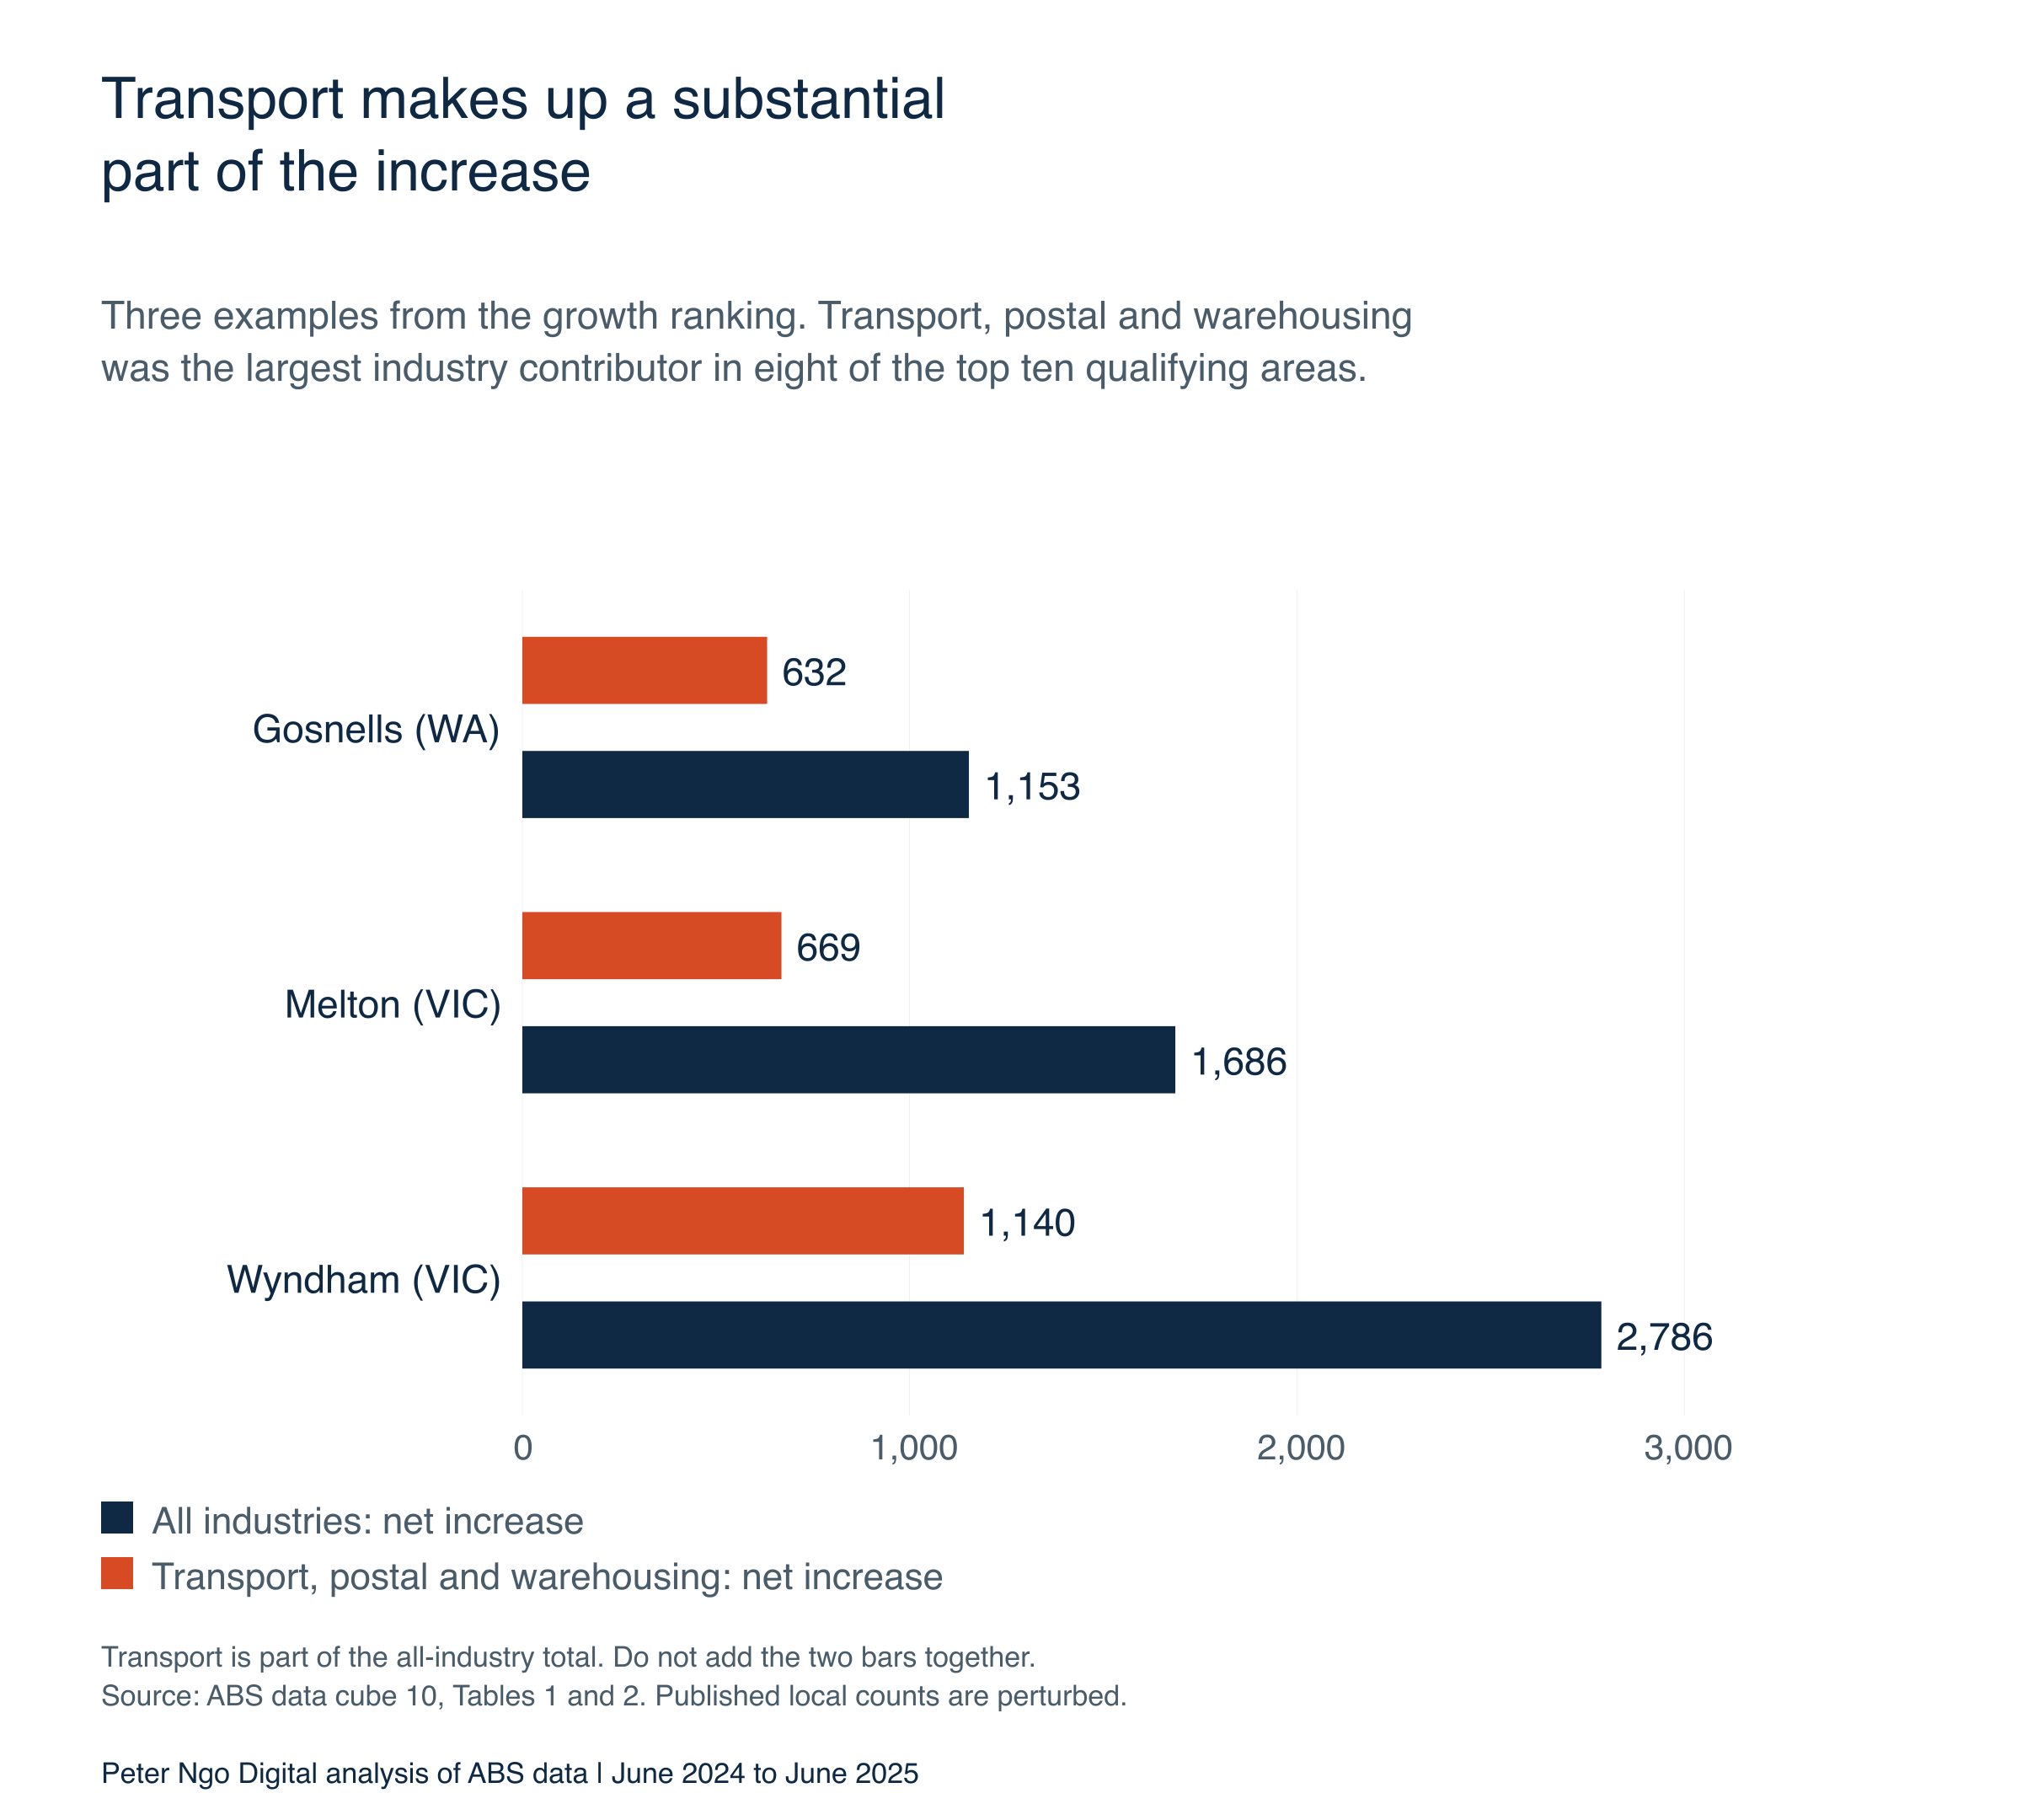
Download chart 5 (PNG) · Download chart 5 (SVG). Click the chart to view it at full size.
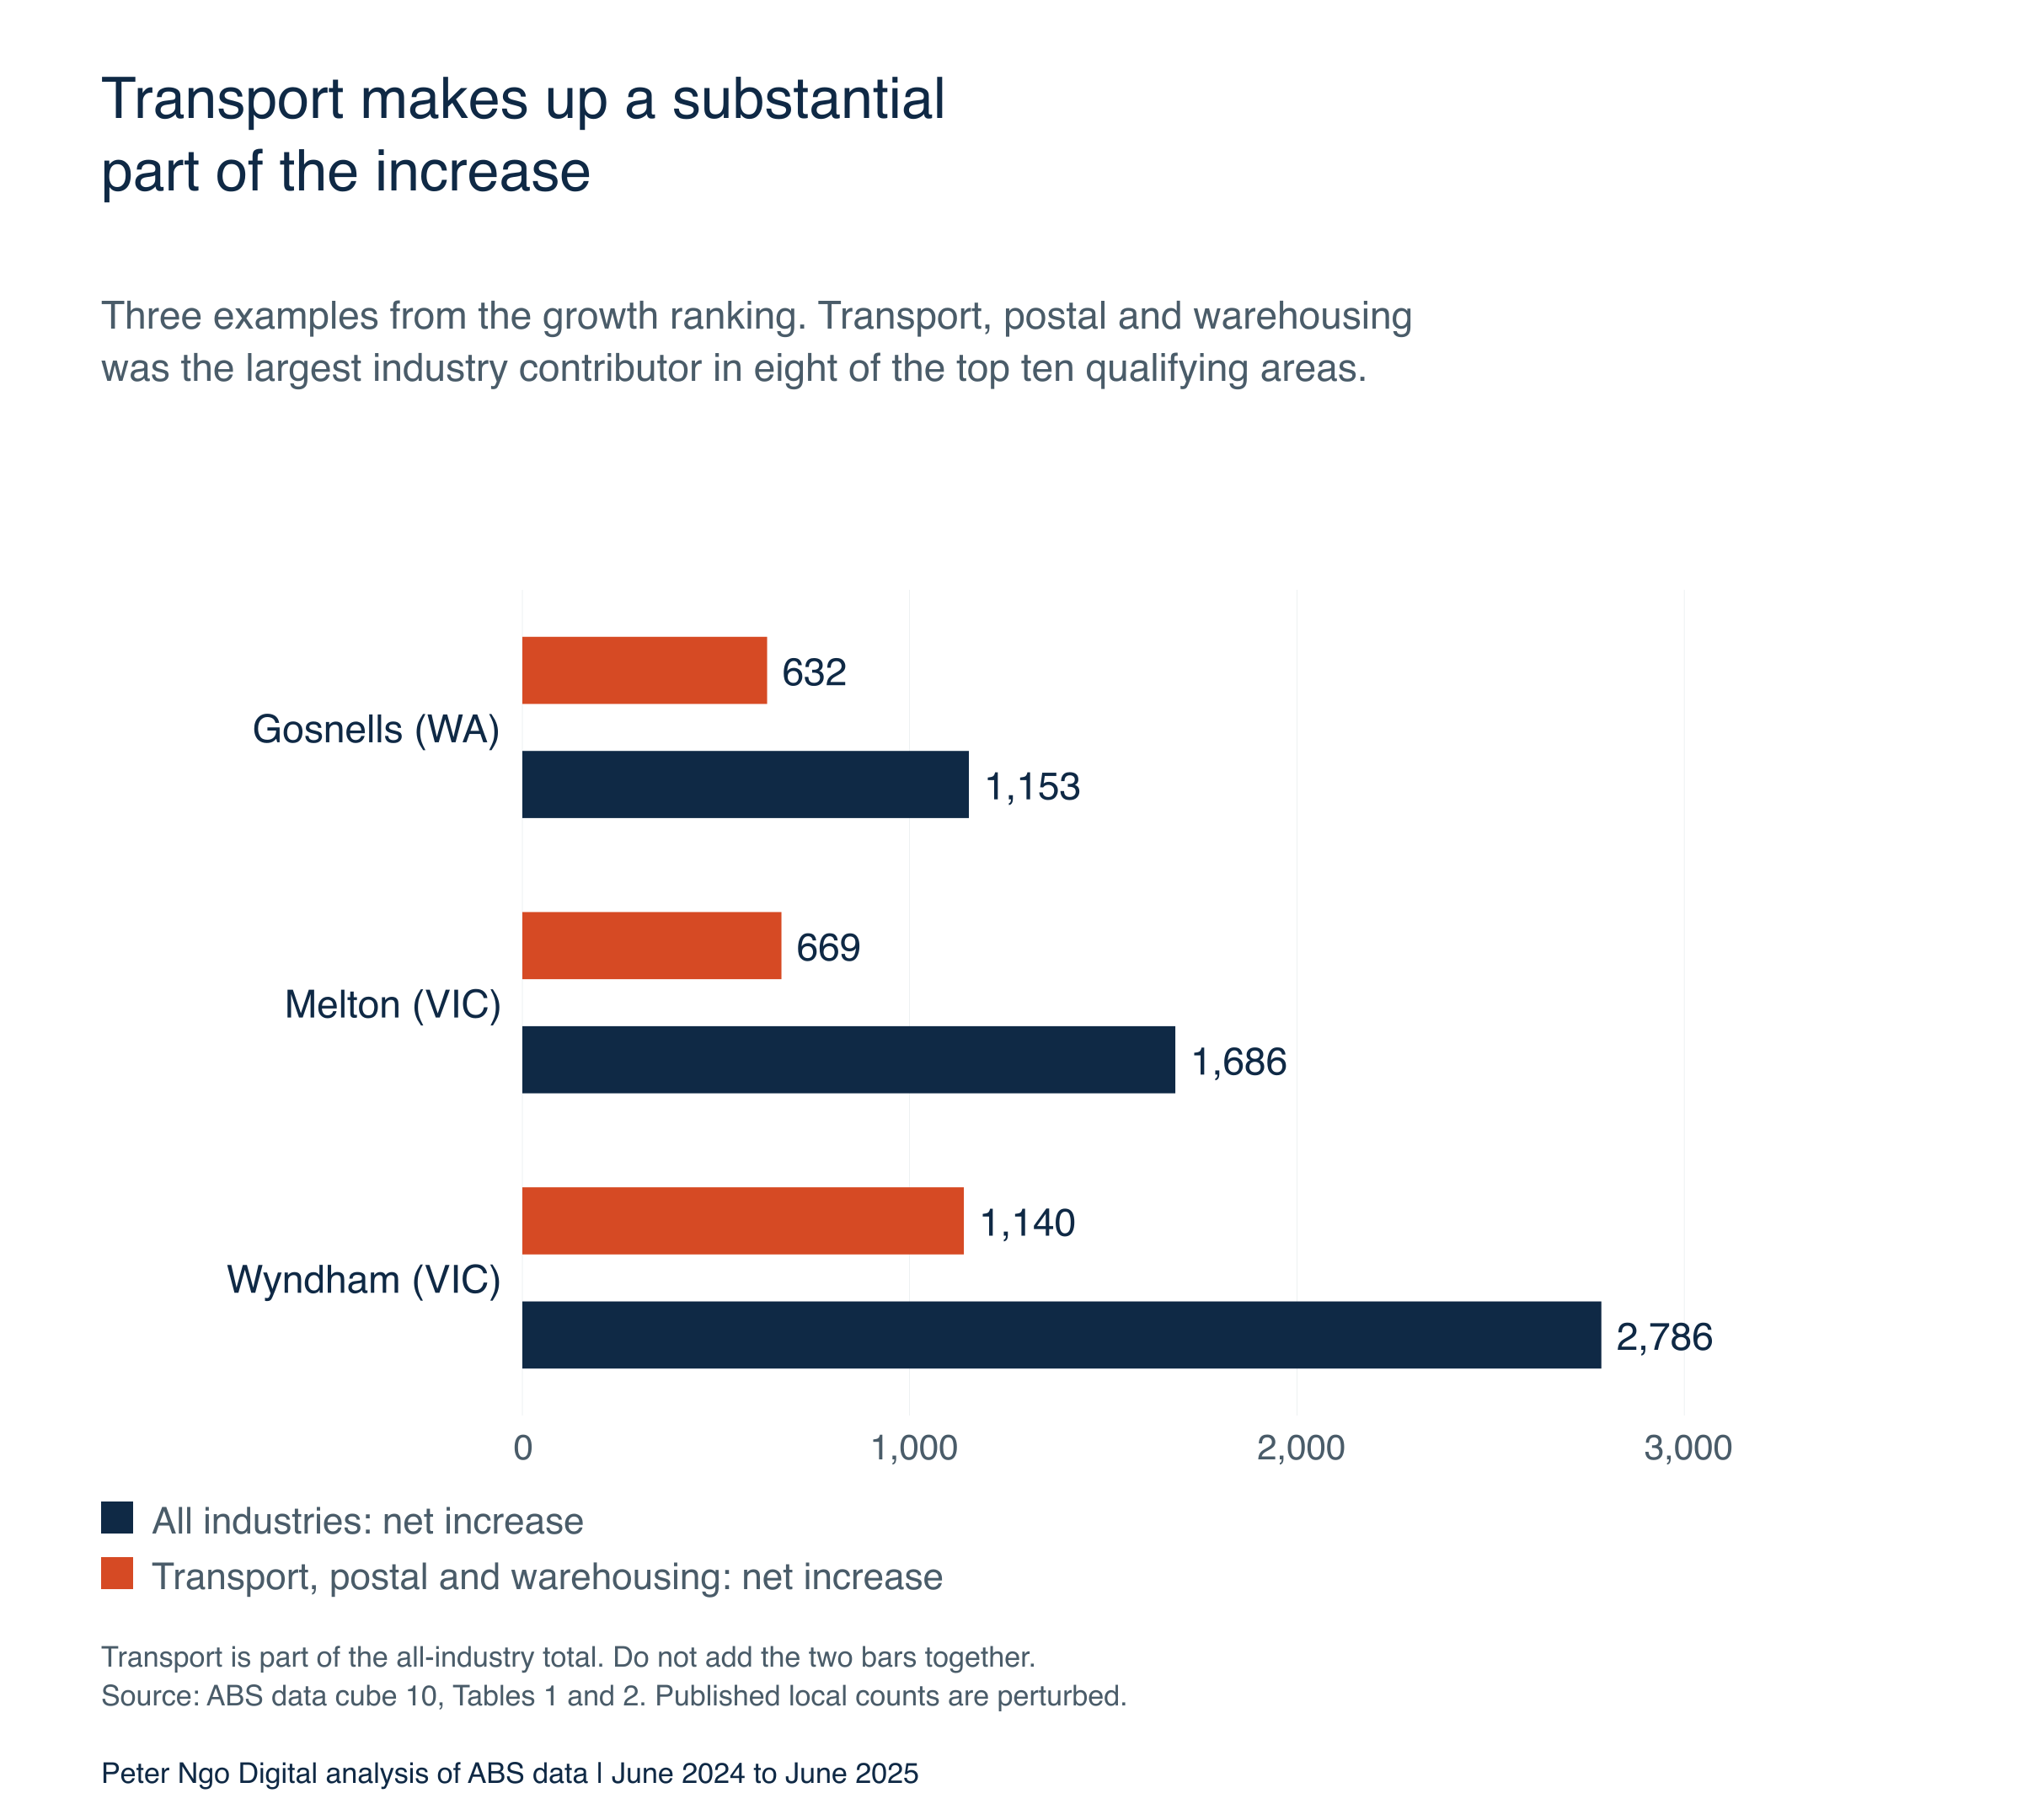
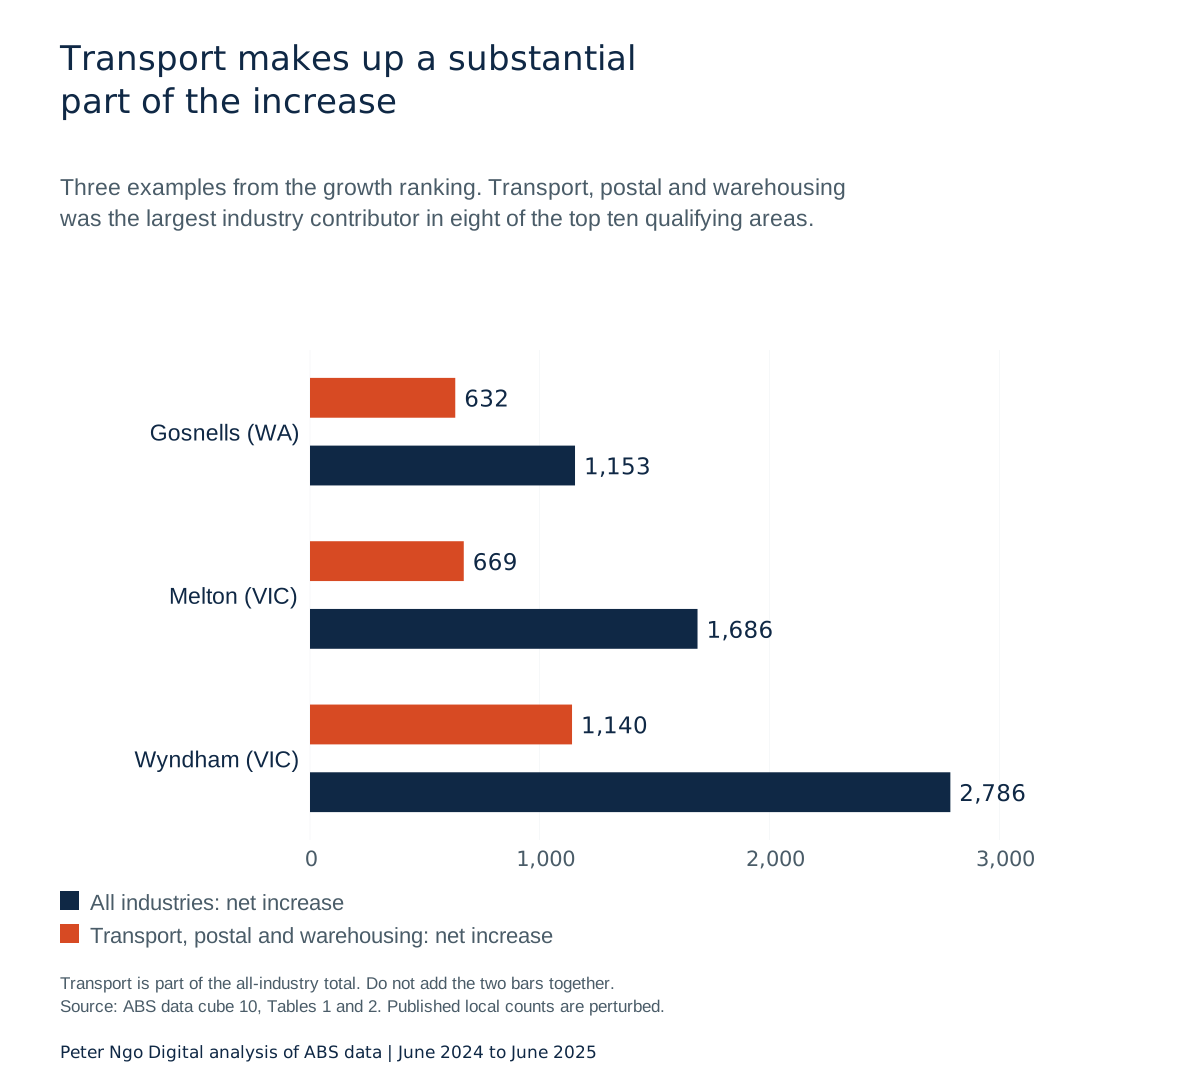
Transport contributed 632 additional businesses in Gosnells, 669 in Melton and 1,140 in Wyndham during 2024–25. The exceptions in the top ten were Camden, where health care and social assistance led with 109 additional businesses, and Rockingham, where construction led with 112. The 2026 national health and construction increases give you newer industry context, rather than proof that those two councils repeated their results.
Gosnells: transport contributed more than half of its 2024–25 increase
Gosnells rose from 9,834 to 10,987 businesses. Transport increased from 2,722 to 3,354, with its increase of 632 representing approximately 54.8% of the overall net increase of 1,153. The City of Gosnells economic profile highlights Albany, Roe and Tonkin highway access as background to its business base. It does not establish the cause of this increase. WA’s newer 4.6% state growth rate cannot be assigned to Gosnells.
Wyndham: more businesses, with a different employment picture
Wyndham added 2,786 businesses in 2024–25, including 1,140 in transport. Its non-employing count increased by 2,893. A category can increase by more than the total when other categories offset its growth, although adjusted local cells should not be treated as exact accounts. The national 2026 increase also leans heavily towards non-employing businesses, but it does not update Wyndham’s own employment split.
Wyndham’s Economic Development Strategy 2022–26 identifies transport among its highest employing sectors in 2023. That earlier workforce context uses a different measure. I would investigate which operators contributed to the local business count increase before describing it as a delivery or freight boom.
Blacktown: transport within a broader 2024–25 increase
Blacktown added 2,030 businesses, or 6.0%, including 769 in transport. Health added 254, rental, hiring and real estate added 214, and professional, scientific and technical services added 188. Blacktown City Council identifies transport and logistics among its main employment sectors and notes M4, M2 and M7 access. NSW’s 26,057 additional businesses in 2025–26 provide newer state context; they do not reveal Blacktown’s share.
Separately, Business NSW’s August 2026 employer analysis covers 2017–25, a different period and measure. Chief executive Daniel Hunter said:
“The goal shouldn’t just be more businesses. It should be more businesses that grow, employ people and create lasting economic opportunities.”
2026 national reference: counts, industries and states
The tables below retain the latest national, state, industry, legal structure and survival figures so you can check the wider context. The first three findings above are prepared comparisons; many values in this reference section are directly published ABS statistics.
If you are looking at where Australian businesses are growing in 2026, I would start by separating three questions:
- Which industries are expanding?
- Where are the increases happening?
- How much of that growth involves businesses with employees?
Australia had 2,814,778 actively trading businesses at June 2026, up 85,130, or 3.1%, over 2025–26. The non-employing category increased by 83,105, representing 97.6% of the net increase. Employing businesses increased by 2,025, or 0.2%. That gives you a different picture from the total alone.
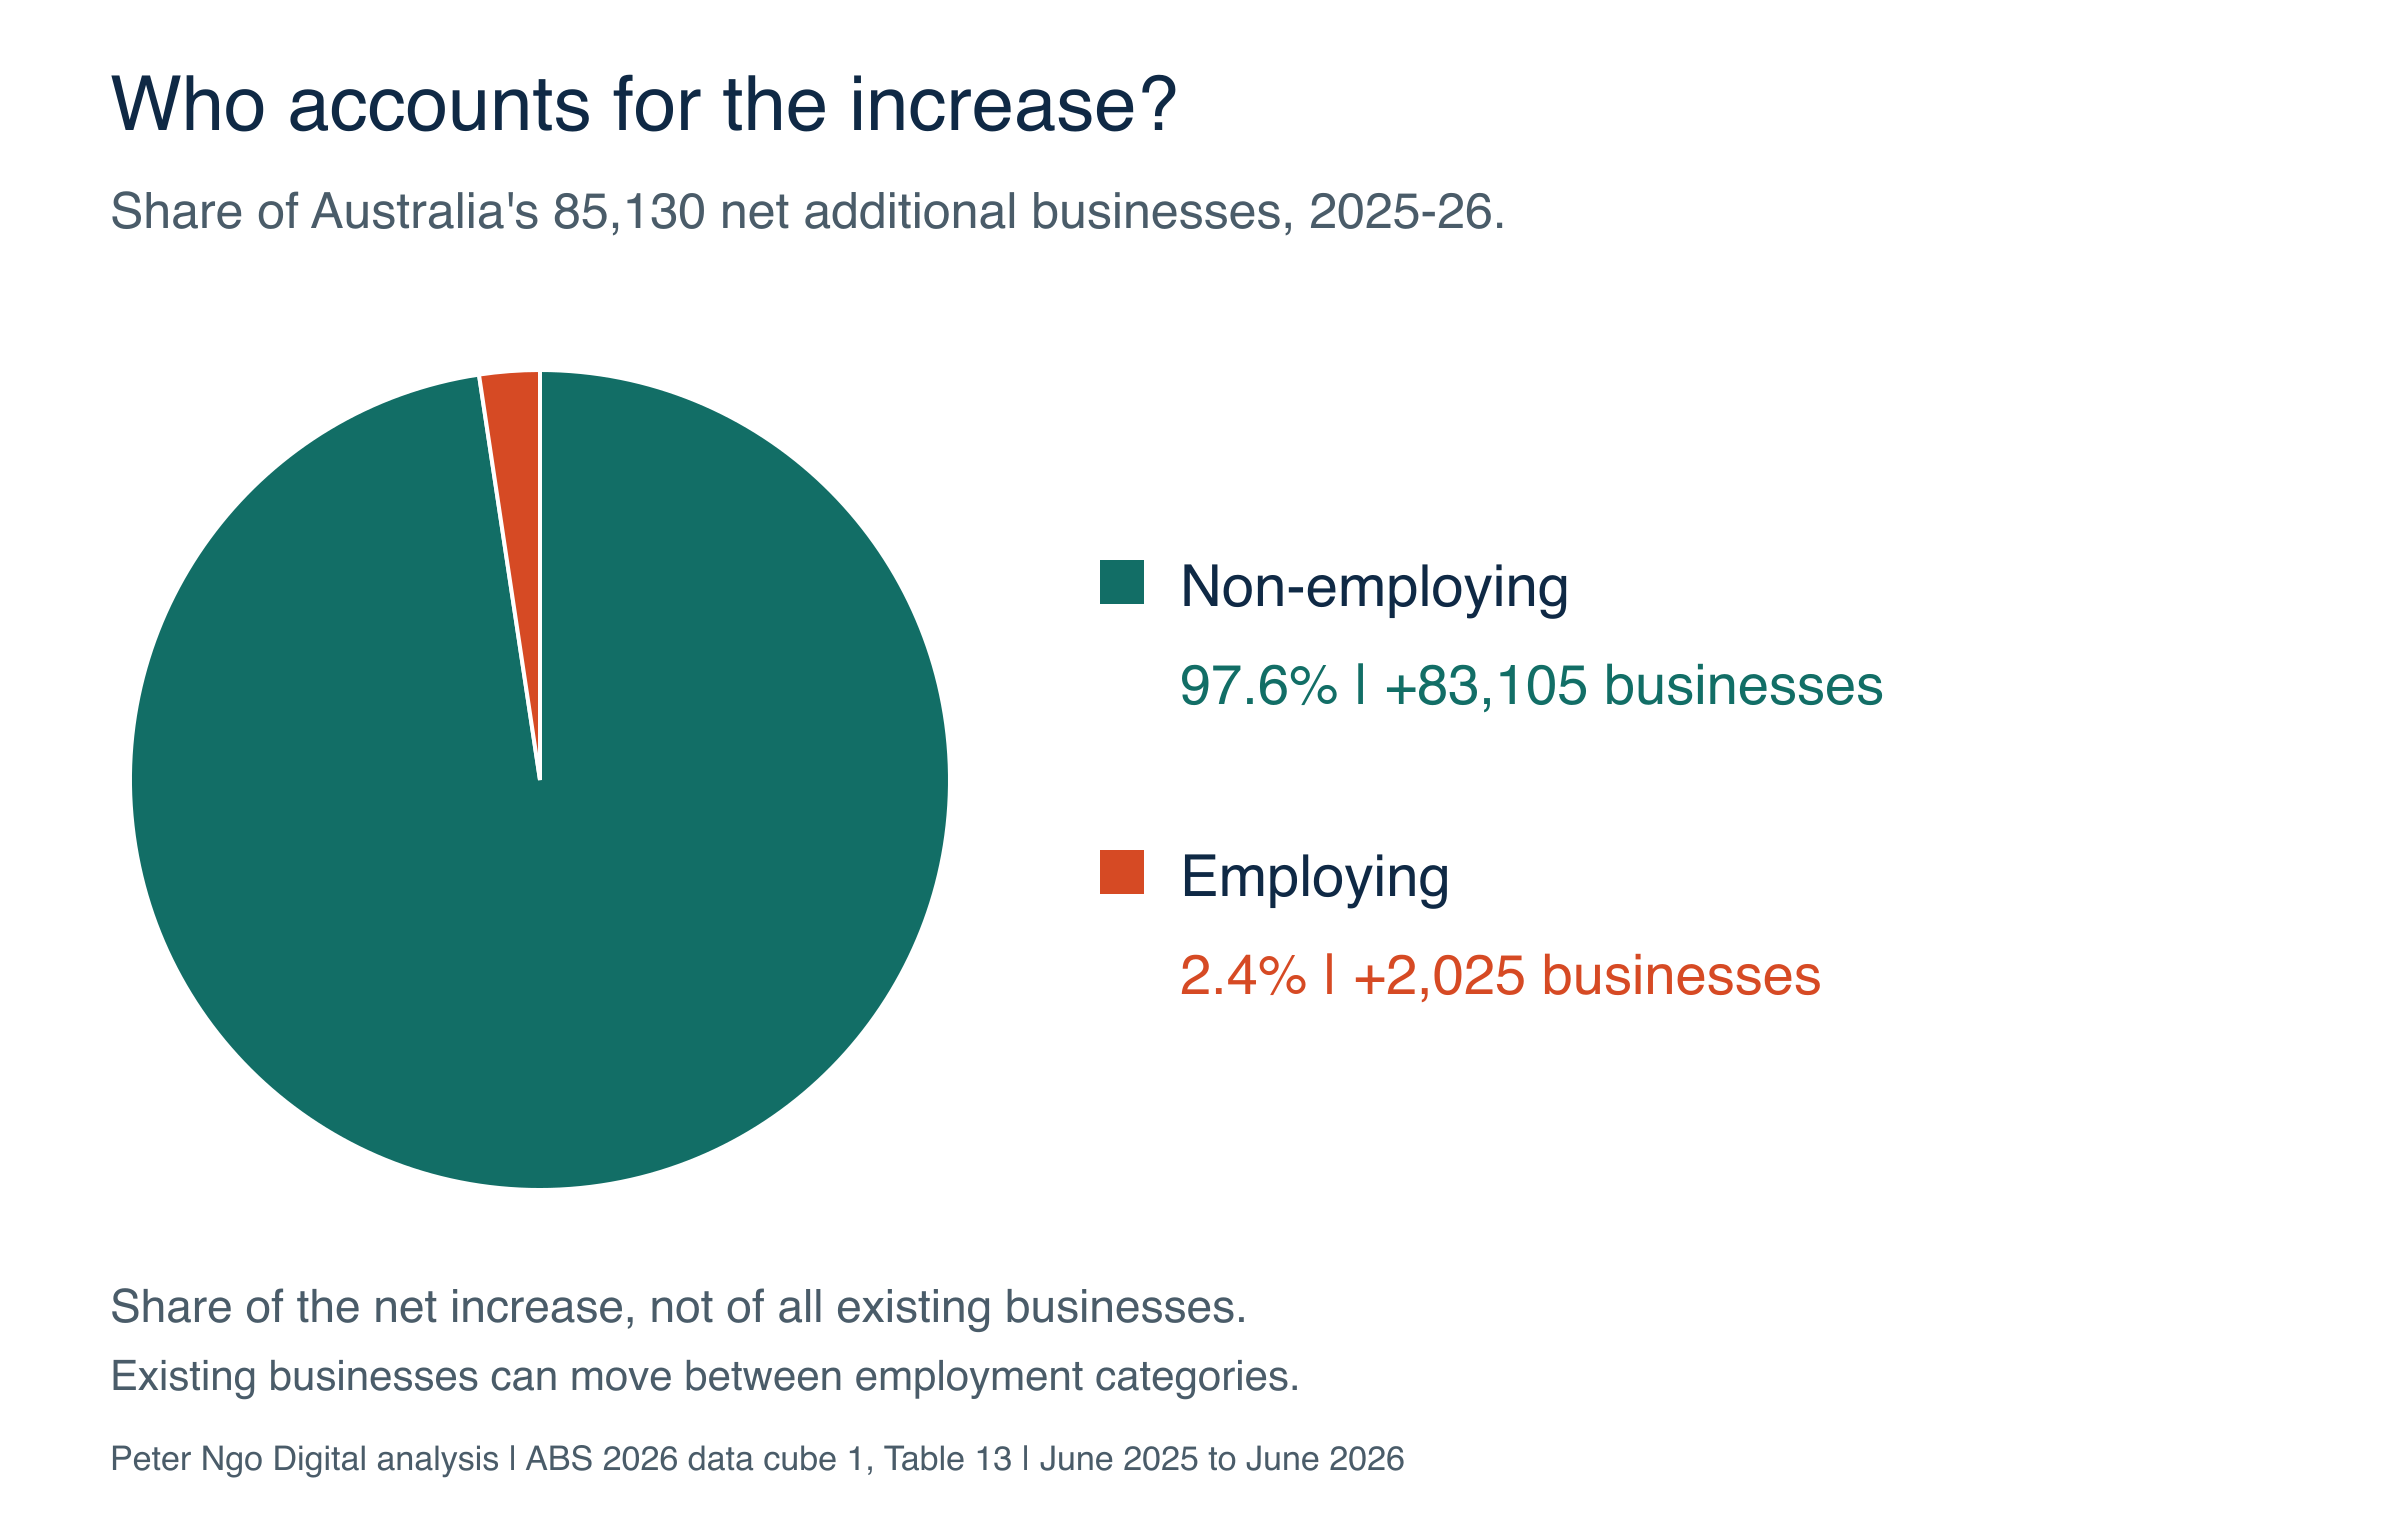
Download chart 6 (PNG) · Download chart 6 (SVG). Click the chart to view it at full size.
Business growth accelerated in 2026, with a small rise in employers
The national count grew by 3.1% in 2025–26, compared with 2.5% in 2024–25. Within that increase, non-employing businesses rose by 4.8% to 1,818,575. The employing count reached 996,203, its first annual net increase since 2021–22, according to ABS.
| Business category | June 2025 | June 2026 | Net change | Growth |
|---|---|---|---|---|
| Non-employing | 1,735,470 | 1,818,575 | +83,105 | 4.8% |
| 1-4 | 688,870 | 689,600 | +730 | 0.1% |
| 5-19 | 232,129 | 232,912 | +783 | 0.3% |
| 20-199 | 67,857 | 68,325 | +468 | 0.7% |
| 200+ | 5,322 | 5,366 | +44 | 0.8% |
| Employing subtotal | 994,178 | 996,203 | +2,025 | 0.2% |
| All businesses | 2,729,648 | 2,814,778 | +85,130 | 3.1% |
The detailed breakdown helps you see how modest the employer increase was. Businesses with one to four employees increased by 730. Those with five to 19 employees added 783, the 20 to 199 group added 468, and businesses with 200 or more employees added 44. These are changes in the number of businesses in each size group, rather than the number of people hired.
Employing businesses had fallen by 4,983 in 2024–25. The 2026 figures therefore change that part of the story, even though almost all the overall net increase sits in the non-employing category. There was also a net movement of 28,127 surviving businesses from employing to non-employing during 2025–26. Existing businesses moving between groups are part of these results.
The 85,130 net increase sits behind much larger entries and exits
ABS recorded 460,461 business entries and 375,331 exits in 2025–26. Subtracting the exits from the entries gives the national net increase of 85,130. The entry rate was 16.9%, while the exit rate was 13.8%.
| Financial year | Entries | Exits | Net increase | Count growth |
|---|---|---|---|---|
| 2022-23 | 406,365 | 356,216 | +50,149 | 2.0% |
| 2023-24 | 436,018 | 362,893 | +73,125 | 2.8% |
| 2024-25 | 437,150 | 370,500 | +66,650 | 2.5% |
| 2025-26 | 460,461 | 375,331 | +85,130 | 3.1% |
Both entries and exits were higher than in 2024–25, with entries increasing enough to produce a larger net gain. I would keep those flows alongside the headline because a growing total can still contain substantial business turnover. An ABS entry is not simply a newly launched startup, and an exit is not necessarily an insolvency or a business failure.
Health grew fastest; construction added the most businesses
Health care and social assistance increased by 14,278 businesses, reaching 227,702 at June 2026. Its 6.7% growth rate was the highest of the 19 industry divisions. Transport, postal and warehousing followed at 4.9%, and financial and insurance services grew by 4.3%.
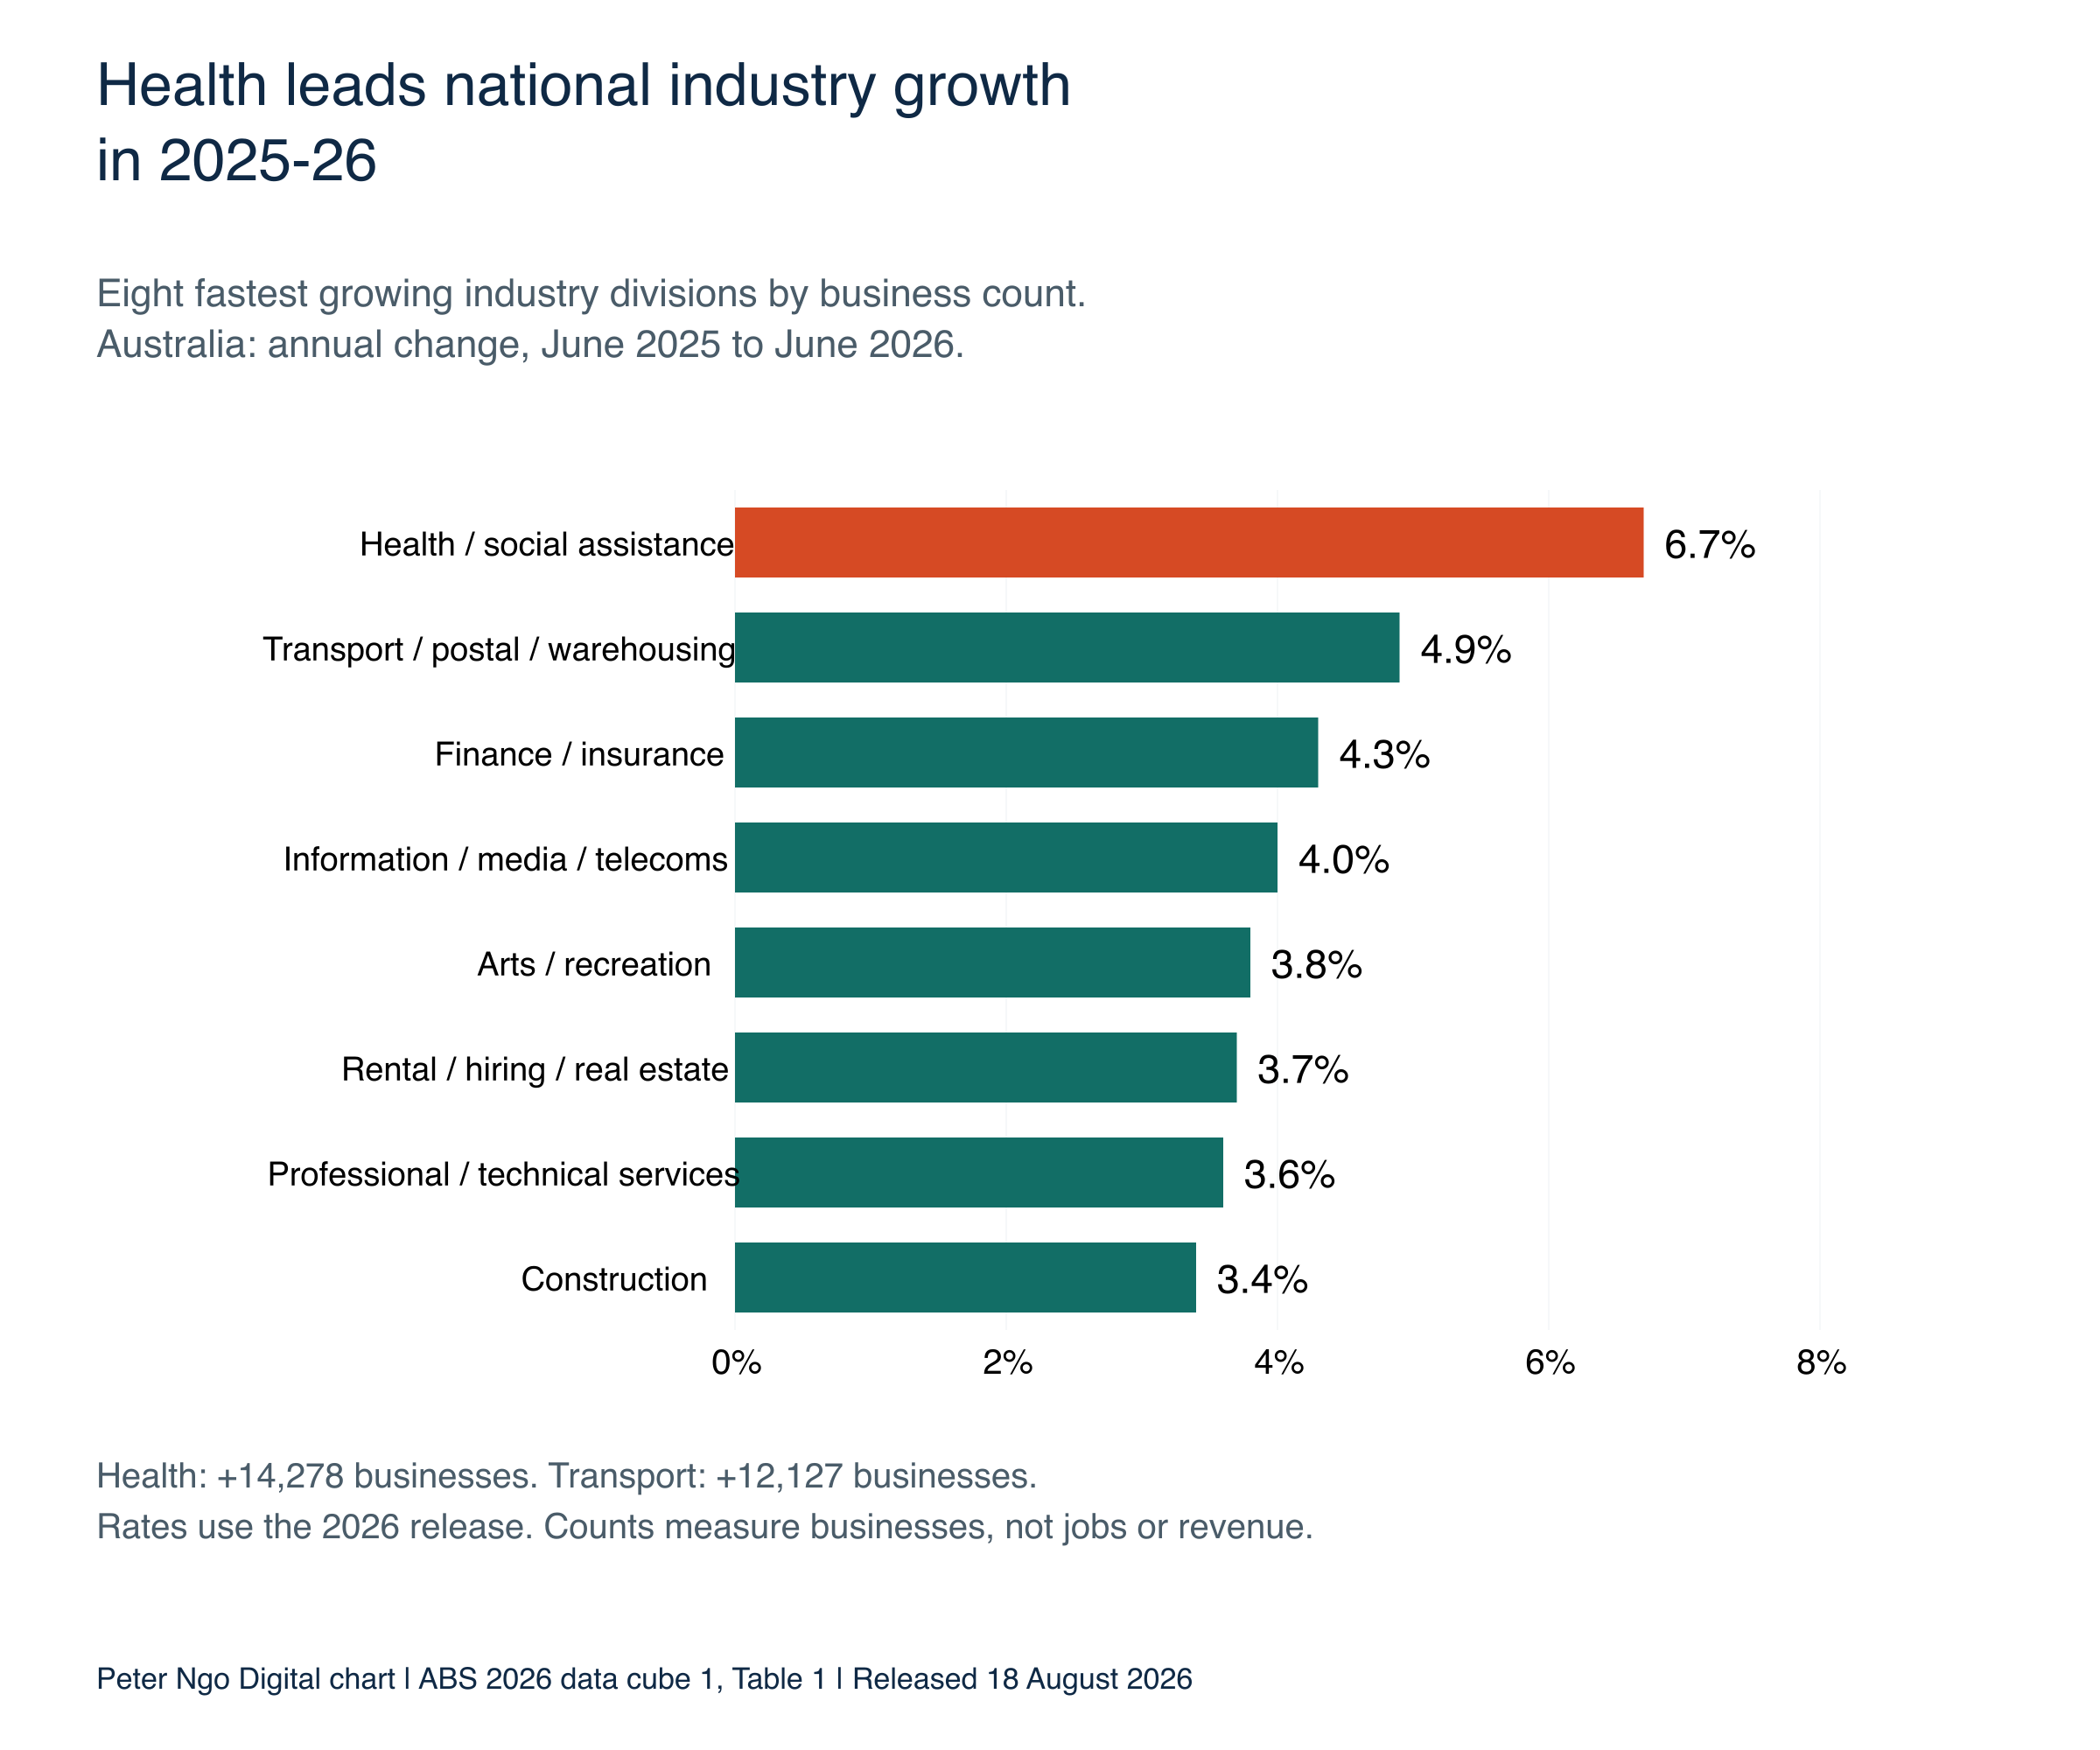
Download chart 7 (PNG) · Download chart 7 (SVG). Click the chart to view it at full size.
Construction had the largest numerical increase among the divisions, adding 15,603 businesses to reach 478,651. Its 3.4% growth rate was lower than health’s because construction started from a much larger base. Percentage growth and additional business counts answer different questions, so the table includes both.
| Industry division | June 2026 | Net change 2025-26 | Growth 2025-26 | Growth 2024-25 |
|---|---|---|---|---|
| Health Care and Social Assistance | 227,702 | +14,278 | 6.7% | 6.6% |
| Transport, Postal and Warehousing | 261,109 | +12,127 | 4.9% | 5.1% |
| Financial and Insurance Services | 139,417 | +5,749 | 4.3% | 3.7% |
| Information Media and Telecommunications | 26,250 | +1,002 | 4.0% | 1.5% |
| Arts and Recreation Services | 40,792 | +1,500 | 3.8% | 2.2% |
| Rental, Hiring and Real Estate Services | 319,717 | +11,511 | 3.7% | 3.1% |
| Professional, Scientific and Technical Services | 366,289 | +12,804 | 3.6% | 2.5% |
| Construction | 478,651 | +15,603 | 3.4% | 2.2% |
| Electricity, Gas, Water and Waste Services | 9,168 | +280 | 3.2% | 1.0% |
| Other Services | 138,735 | +4,213 | 3.1% | 2.7% |
| Education and Training | 44,236 | +1,190 | 2.8% | 2.4% |
| Administrative and Support Services | 130,330 | +3,299 | 2.6% | 2.6% |
| Public Administration and Safety | 7,908 | +137 | 1.8% | 1.8% |
| Accommodation and Food Services | 114,369 | +1,498 | 1.3% | 1.2% |
| Mining | 8,755 | +95 | 1.1% | 0.9% |
| Wholesale Trade | 82,448 | +379 | 0.5% | 0.1% |
| Manufacturing | 90,879 | +192 | 0.2% | 0.2% |
| Retail Trade | 156,143 | +125 | 0.1% | -0.4% |
| Agriculture, Forestry and Fishing | 170,185 | -861 | -0.5% | -0.8% |
Transport’s national growth rate slowed from 5.1% in 2024–25 to 4.9% in 2025–26. It still added 12,127 businesses, but the latest figures give us a reason to be careful with a broad transport boom headline. The council analysis shows where transport contributed most in 2024–25; it cannot tell us whether the same places led again in 2026.
Retail trade was almost flat, increasing by 125 businesses, or 0.1%, to 156,143. Accommodation and food services added 1,498, or 1.3%. Agriculture, forestry and fishing was the only industry division with a decrease, falling by 861 businesses, or 0.5%. These are entity counts within broad industries, so they cannot establish how busy shops are, whether a dental clinic has spare appointments or how much an individual firm earns.
WA grew fastest, while NSW accounted for the largest increase
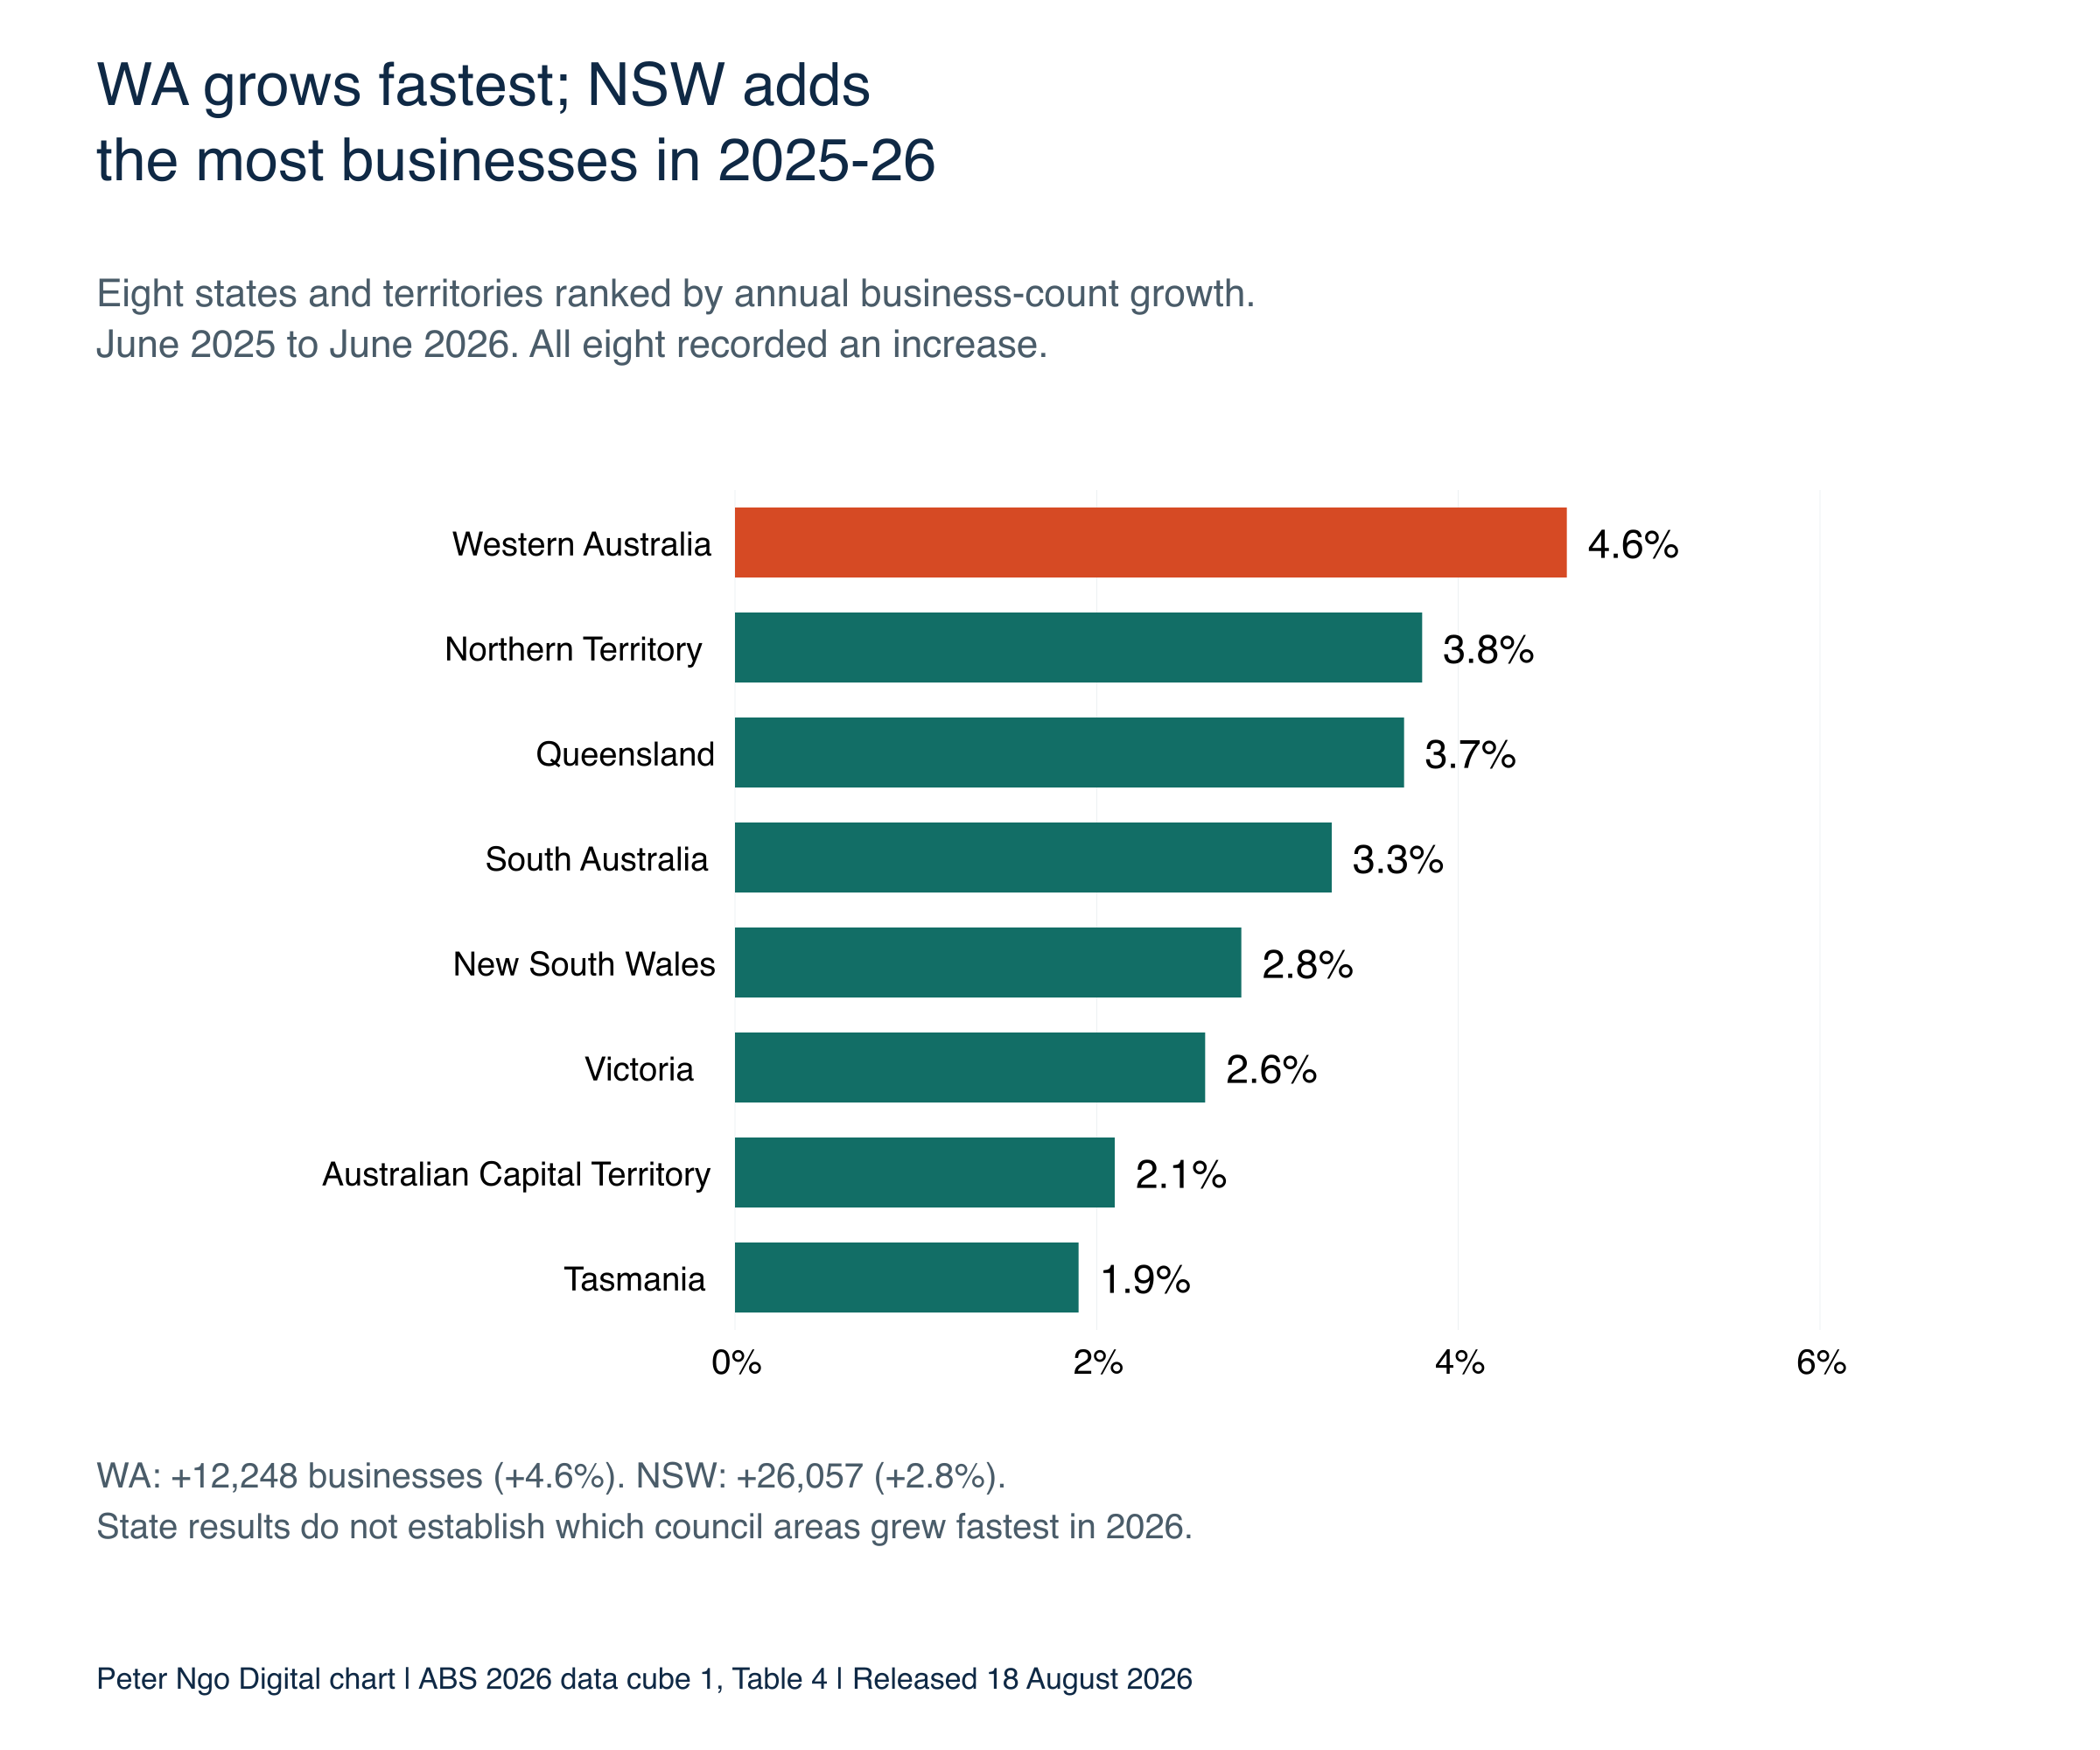
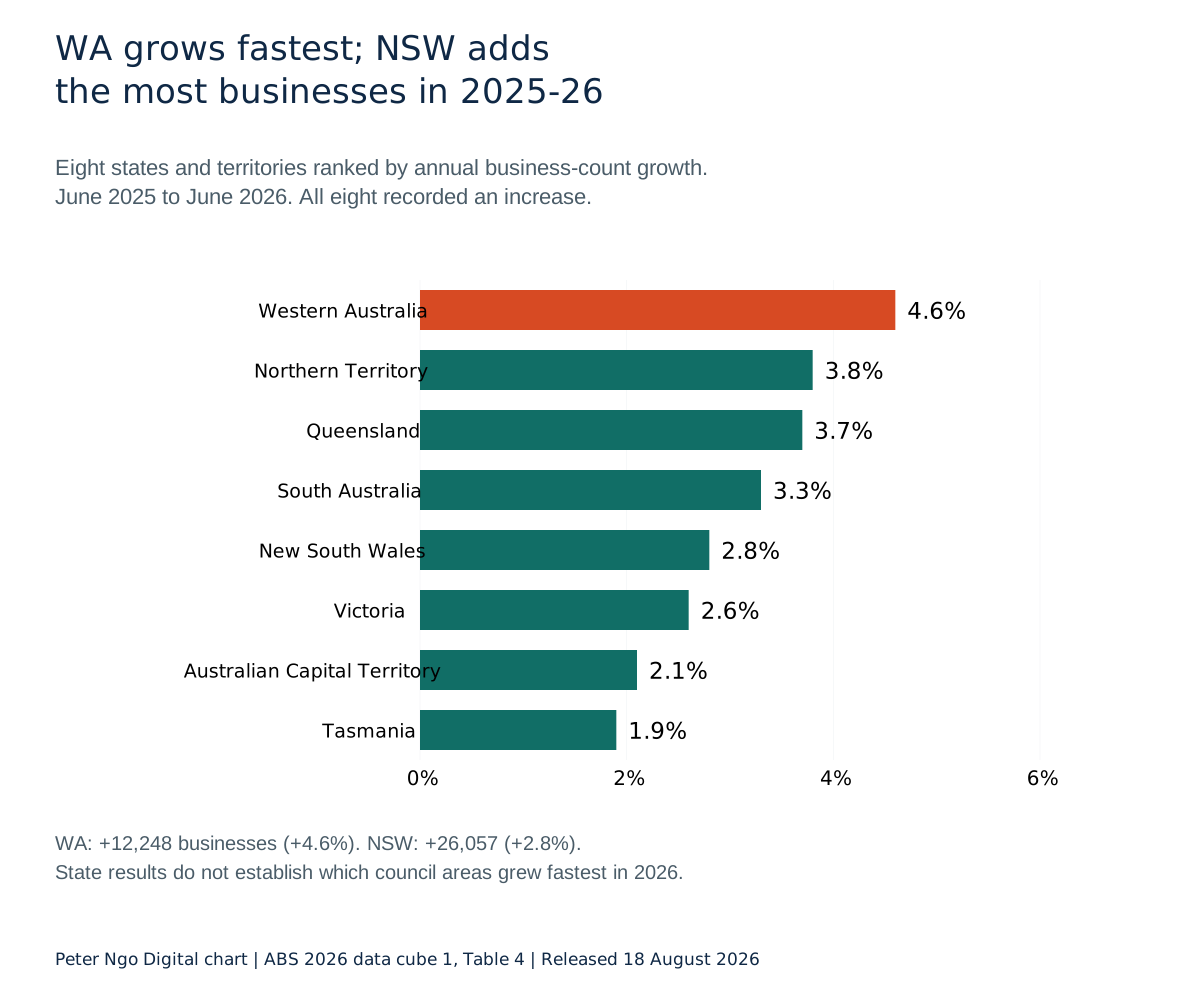
All eight states and territories recorded business growth in 2025–26. Western Australia’s count rose by 4.6%, adding 12,248 businesses. NSW added 26,057, more than any other state or territory, while Victoria added 19,581 and Queensland added 19,244.
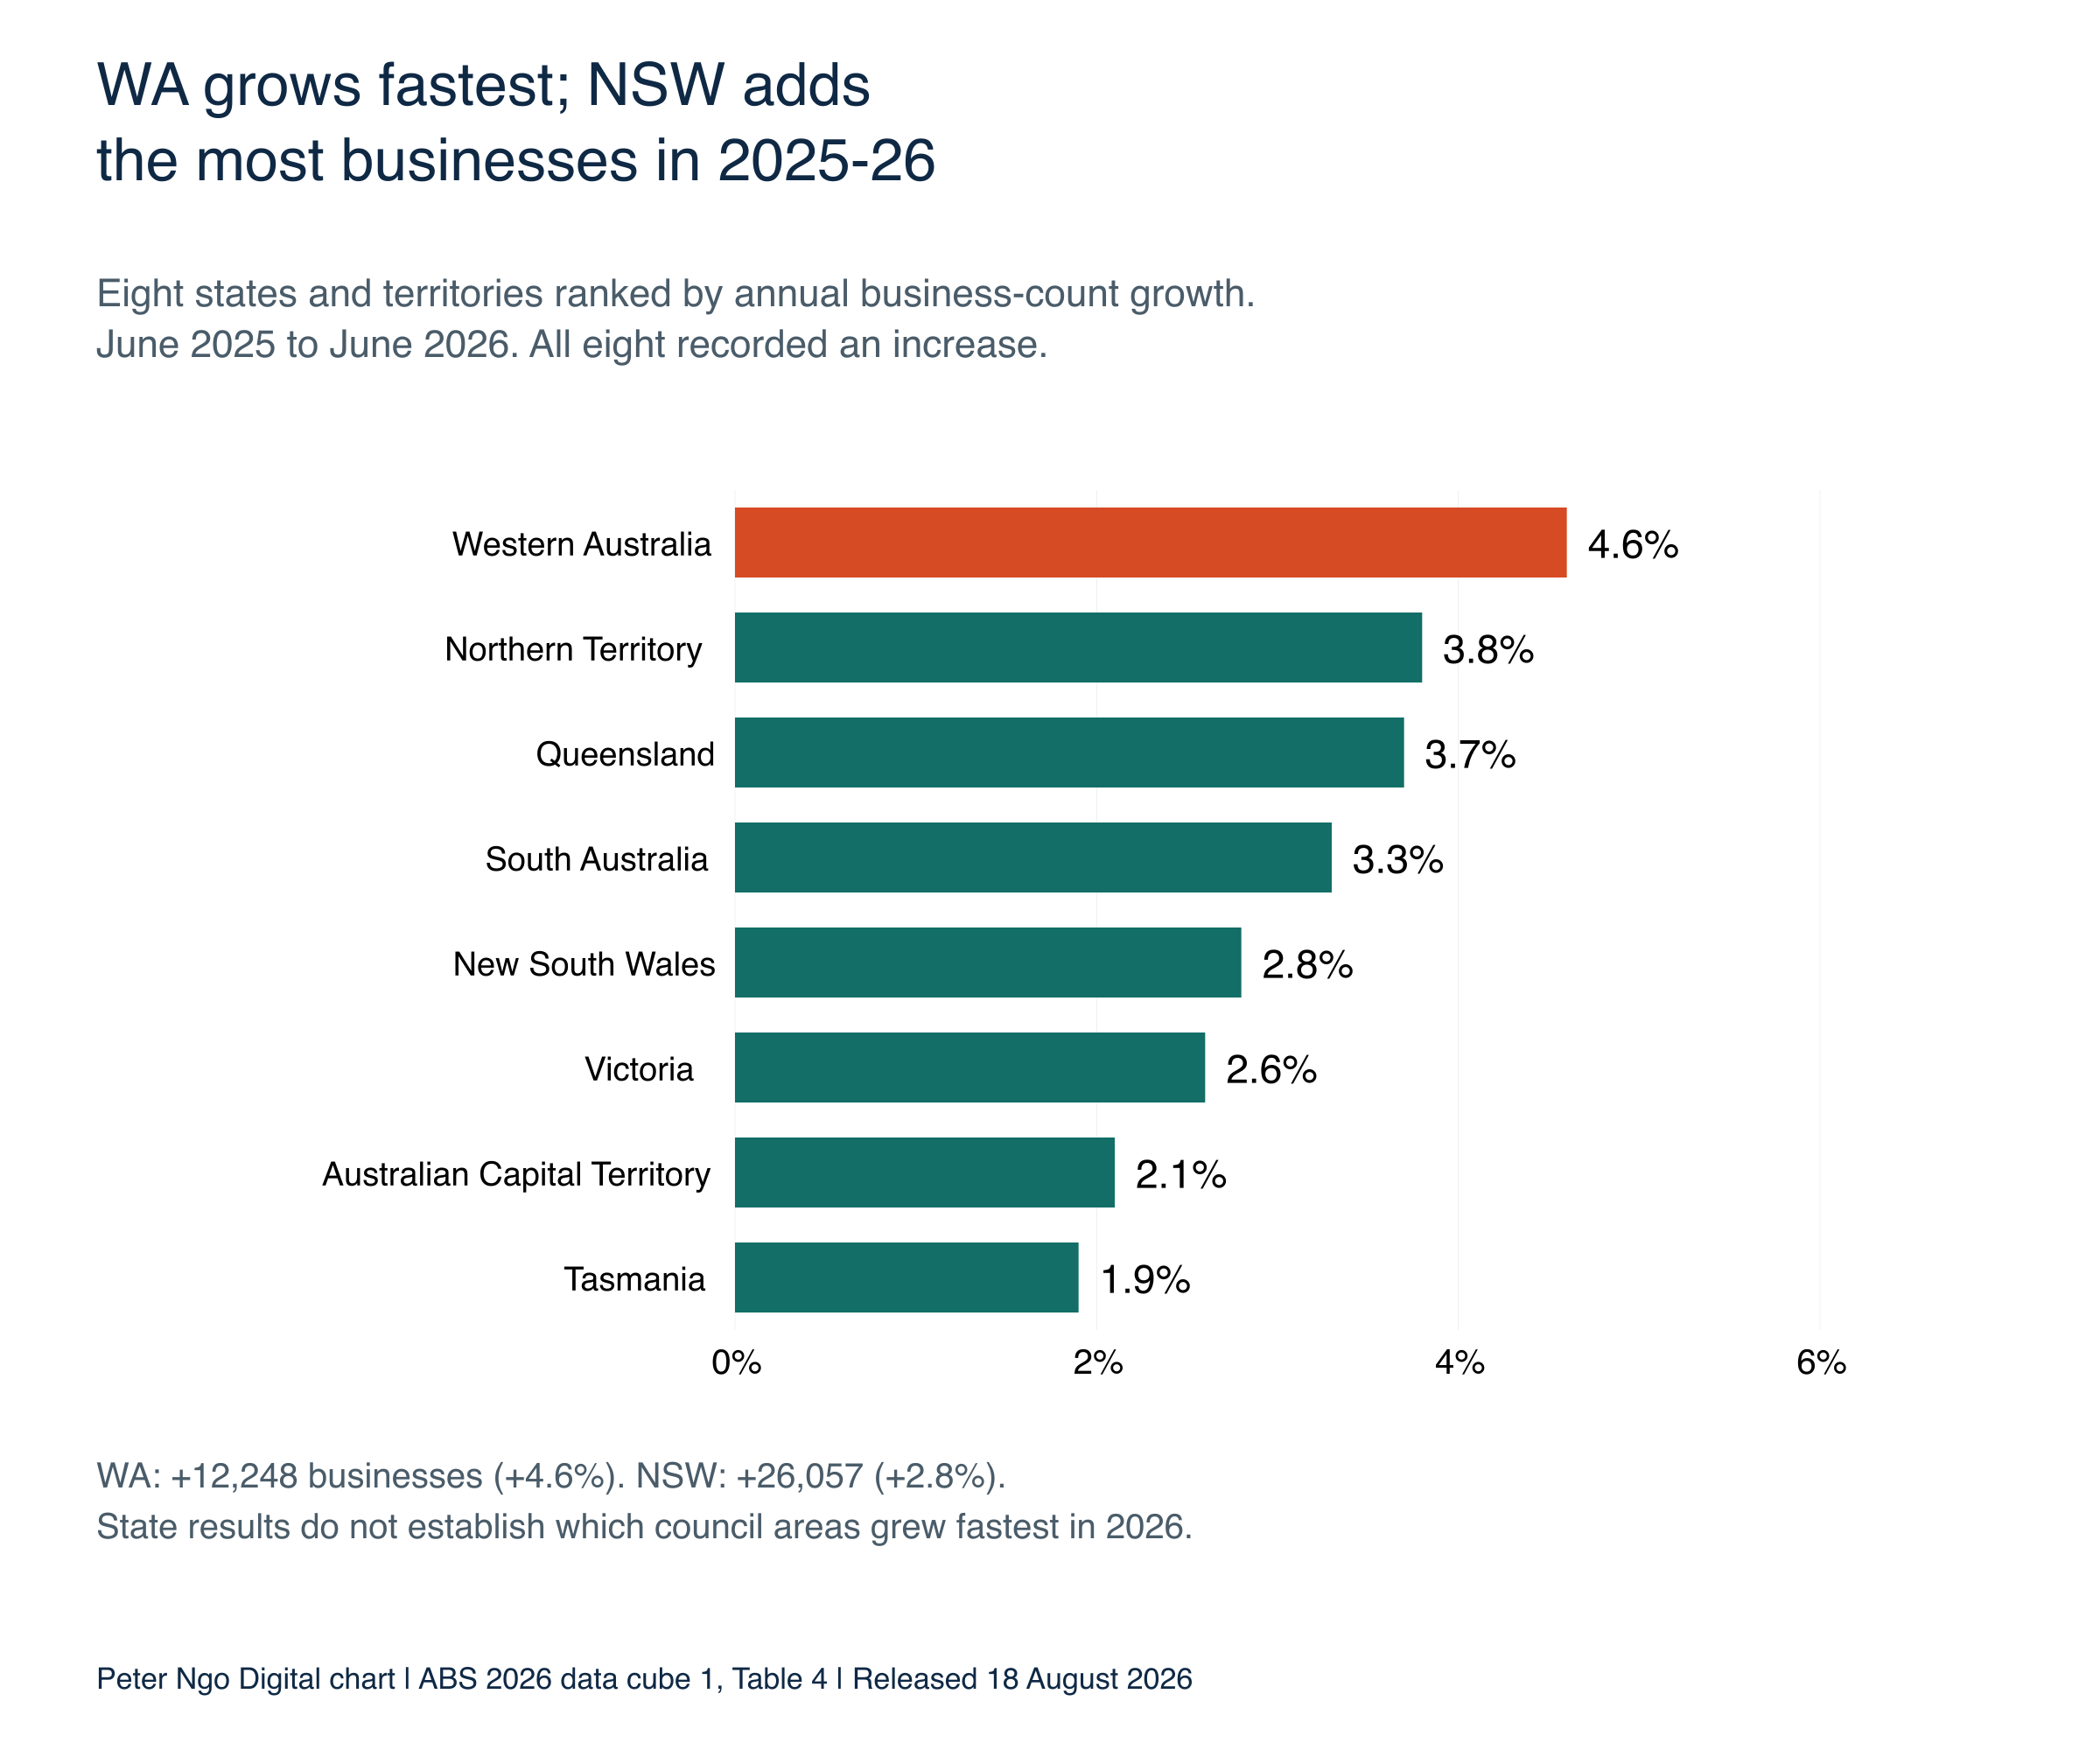
Download chart 8 (PNG) · Download chart 8 (SVG). Click the chart to view it at full size.
| State or territory | June 2026 | Net change 2025-26 | Growth 2025-26 | Growth 2024-25 |
|---|---|---|---|---|
| Western Australia | 278,520 | +12,248 | 4.6% | 4.3% |
| Northern Territory | 17,440 | +643 | 3.8% | 2.5% |
| Queensland | 543,277 | +19,244 | 3.7% | 2.7% |
| South Australia | 174,310 | +5,613 | 3.3% | 2.6% |
| New South Wales | 942,658 | +26,057 | 2.8% | 2.2% |
| Victoria | 773,986 | +19,581 | 2.6% | 2.2% |
| Australian Capital Territory | 37,785 | +789 | 2.1% | 1.9% |
| Tasmania | 45,094 | +850 | 1.9% | 0.5% |
If you are choosing which state to investigate, WA’s faster rate and NSW’s larger numerical increase are both useful starting points. Neither tells you which suburb or industry has the best opportunity for your business. The state table compares 2026 with the previous annual rate from the same ABS release, while the local section retains its older dates.
Non-employing growth does not mean the same thing as sole trader growth
Employment size describes whether a business has employees. Legal organisation describes its structure. A company can be non-employing, so I would not turn the 83,105 increase in non-employing businesses into a claim about new sole traders.
| Legal organisation | June 2026 | Net change 2025-26 | Growth |
|---|---|---|---|
| Total Companies | 1,271,197 | +63,373 | 5.2% |
| Sole Proprietors | 848,300 | +25,427 | 3.1% |
| Total Partnerships | 196,015 | -8,682 | -4.2% |
| Trusts | 498,865 | +5,009 | 1.0% |
| Public Sector | 401 | +3 | 0.8% |
Companies added 63,373 businesses in 2025–26, reaching 1,271,197. Sole proprietors increased by 25,427 to 848,300, while partnerships decreased by 8,682. Those figures come from the legal organisation table and overlap with the employment categories. You cannot add the company increase to the non-employing increase to calculate extra businesses.
Growth and business survival need different comparisons
The latest release also lets us follow older groups of businesses through to June 2026. Of businesses operating in June 2022, 61.9% survived to June 2026. For the separate group that entered during 2022–23, 49.2% survived to June 2026.
| Original cohort | Businesses in cohort | Survived to June 2026 | Survival rate |
|---|---|---|---|
| Operating June 2022 | 2,539,724 | 1,571,449 | 61.9% |
| Entered 2022-23 | 406,365 | 199,742 | 49.2% |
These percentages describe different starting groups over several years. They are not the percentage of Australian businesses that failed during 2026. If you use the survival figures in a story, retain the cohort and dates so the comparison stays meaningful. The download includes both cohorts by industry.
How I would use the 2026 figures to research a market
Let’s say you supply accounting services and are deciding which industries to research. The latest industry table gives you health’s 6.7% growth, transport’s 4.9% and construction’s larger numerical increase. The employment and legal structure tables then help you avoid treating all of those additional businesses as new employers or sole traders.
You can compare states using the 2026 figures, then use the older council data to form more specific local questions. If Wyndham interests you, for example, its earlier transport increase gives you a reason to investigate the types of operators there. You would still need current local evidence, customer needs, competitor information and operating locations before deciding where to invest. These counts help you narrow the research; they do not establish demand for your service.
Download the 2026 data, charts and journalist reference pack
Download the complete reference pack (ZIP): eight charts in PNG and SVG, twelve CSVs, source notes and suggested reference wording. Each chart retains its own reference period. No email form is required.
2026 study data: Employment sizes · All 19 industry divisions · Eight states and territories · Entries and exits, 2022–23 to 2025–26 · Legal organisation · Survival cohorts through June 2026. CSVs include source cells; industry and state files also carry the previous annual comparison from the latest release.
Search, sort and export council records · 2026 industry pickup calculations · 2026 employment movement calculations · Complete council and industry inputs · Reproduce the three findings with Python (plain text).
Historical council detail: All 536 comparable areas, June 2023–2025 · Top ten qualifying areas, 2024–25 · Transport comparison across 135 areas, 2024–25. Source notes and data dictionary · Suggested reference wording.
Suggested wording for reporting
Peter Ngo Digital’s analysis of the ABS August 2026 release found that Australia added 85,130 actively trading businesses over 2025–26. The non-employing category accounted for 83,105, or 97.6% of that net increase, while employing businesses increased by 2,025. Health care and social assistance grew fastest among industry divisions at 6.7%. WA had the fastest state growth at 4.6%, while NSW added the most businesses, with 26,057.
For the separate local finding, retain its earlier dates: transport was the sole largest contributor in eight of the ten fastest growing qualifying council areas between June 2024 and June 2025, versus 14 of the other 125. The threshold was at least 5,000 businesses at June 2024. This is not a 2026 council ranking.
You can reproduce the charts and tables with credit to Peter Ngo Digital and ABS, retaining their dates, definitions and footnotes. Suggested credit: “Peter Ngo Digital analysis of ABS Counts of Australian Businesses, July 2022 to June 2026, data cube 1; historical council analysis from July 2021 to June 2025, data cube 10.” Original ABS material is © Commonwealth of Australia under Creative Commons Attribution 4.0, subject to published exceptions. This is independent analysis, without ABS endorsement. For a calculation query or correction, contact [email protected].
Sources, calculations and data limits
Added V4 calculations: pickup = the 2025–26 annual net change minus the 2024–25 annual net change. Its denominator is 85,130 minus 66,650, or 18,480. Construction’s 5,585 plus professional services’ 4,141 gives 9,726, divided by 18,480 = 52.6%. Table 1 includes an unknown category, whose change of 54 is retained in the national reconciliation. The movement share is 28,127 divided by 83,105 = 33.8%. It is a share of the non-employing increase; movement cancels nationally. All inputs, source cells, formulas and a standard-library reproduction script are in the pack.
The 2026 analysis uses ABS July 2022 to June 2026, data cube 1: Table 1 for industries and national entries/exits, Table 4 for states, Table 10 for legal organisation, Table 13 for employment, and Tables 2 and 3 for survival. Annual comparisons, including the earlier 2024–25 rates, come from this same latest release. Revised earlier values are not mixed with the older council release.
Annual net change is the end count minus the start count. Growth is that difference divided by the start count, multiplied by 100. Tables display ABS rates rounded to one decimal place. The 97.6% figure is 83,105 divided by 85,130, multiplied by 100. It describes the share of the net increase, not the share of entries or all existing businesses. Employment totals include overlapping subtotals, so do not sum every row. The 19 industry and eight state rows exclude unknown/other territory placeholders; national totals include them.
The historical council source is ABS July 2021 to June 2025, data cube 10, Tables 1, 2 and 3 for June 2025, 2024 and 2023. These regional tables were released on 16 December 2025. The source workbooks for both editions were downloaded on 3 November 2026 and retained unchanged.
I matched council and industry codes within the older release, checked names across years, excluded missing observations rather than replacing them with zeros, and removed geographic placeholders and unincorporated areas. That leaves 536 comparable council areas, with 135 meeting the main threshold. Annual growth ranks use unrounded values, with council code breaking ties. A leading industry has the largest numerical increase within the area. This is a descriptive comparison, without a causal claim or a statistical significance test.
| Minimum June 2024 businesses | Eligible areas | Top ten: transport sole leaders | Other areas: transport sole leaders |
|---|---|---|---|
| 1,000 | 301 | 9 of 10 | 25 of 291 (8.6%) |
| 5,000 | 135 | 8 of 10 | 14 of 125 (11.2%) |
| 10,000 | 81 | 7 of 10 | 8 of 71 (11.3%) |
The main local result uses sole transport leaders: eight of the top ten and 14 of the other 125 areas. Including joint leaders adds Greater Shepparton and Melville to the second group, giving 16 of 125, or 12.8%; the top ten remains eight. Both flags appear in the CSV. The sensitivity table changes the minimum starting size while keeping the same June 2024–2025 period and sole leader definition.
ABS counts actively trading businesses within its market sector coverage, which differs from all ABNs, premises or new registrations. A business operating in several places is allocated to one geography; complex profiled businesses can sit in a no usual address category outside our council ranking. Local figures are perturbed to protect confidentiality, so components may not sum to totals. I used published council totals rather than rebuilding them from industry cells.
Employment measures can lag the business count date. Survival measures track a specified original cohort, and exits do not establish insolvency. Neither national nor local business counts establish jobs, profitability, spending, vacancies or demand for a service. See the 2026 ABS methodology and the older regional methodology for coverage and definitions. Check the reference period of each table before using it in a later story.